
When you hear traders talk about an option's "fair value," they're referring to its theoretical price. This isn't the price you see flickering on your screen; it's a calculated estimate of what an option should be worth based on a specific financial model.
Think of it as a professional appraisal for a piece of property. The appraisal gives you a baseline value, separate from the emotional bidding wars that can drive up the final sale price.
Understanding an Option's Theoretical Price

Let's stick with that real estate analogy. An appraiser might peg a house's value at $500,000 after analyzing its size, condition, location, and what similar homes have sold for. This is its theoretical value—an objective assessment.
But if it's a seller's market with low inventory, buyers might frantically bid the price up to $525,000. That's the market price, a figure completely driven by current supply and demand.
An option's theoretical price works in the exact same way. It’s a benchmark calculated by a model, giving you a reference point for "fair value." The market price, on the other hand, is the live price tag determined by the tug-of-war between buyers and sellers at any given moment.
For traders, knowing the difference is what separates guessing from strategy. When you can compare a calculated fair value to the live market price, you're no longer flying blind. You can start spotting real opportunities.
The core idea is simple: Is the option currently trading for more or less than what a financial model says it's worth? Answering this question is the first step toward finding a tangible trading edge.
Why This Matters for Traders
Grasping this concept gives you a serious advantage, especially if you're a swing or wave trader looking for repeatable patterns. It helps you do three critical things:
- Identify Mispricings: You can quickly spot options that seem way too cheap (undervalued) or suspiciously expensive (overvalued) compared to their theoretical "fair" price.
- Gauge Market Sentiment: The difference between the theoretical and market price is a great sentiment gauge. A big premium over the theoretical price often signals greed, while a discount can indicate fear.
- Improve Entry and Exit Points: Imagine a stock you're watching pulls back to a key support level in its channel. By finding call options trading below their theoretical value, you can position yourself for a potentially more profitable bounce.
Theoretical Price vs. Market Price at a Glance
To really hammer this home, let’s put the two concepts side-by-side. The theoretical price is born from math, while the market price is born from human psychology and order flow.
This table breaks down the core differences:
| Attribute | Theoretical Price | Market Price |
|---|---|---|
| Origin | Calculated using a financial model (e.g., Black-Scholes). | Determined by real-time supply and demand in the market. |
| Nature | Objective and data-driven, based on specific inputs. | Subjective and dynamic, influenced by news and sentiment. |
| Purpose | Acts as a benchmark or 'fair value' estimate. | Represents the actual cost to buy or sell the option now. |
| Key Driver | Mathematical inputs like volatility, time, and interest rates. | The collective actions and emotions of buyers and sellers. |
As you can see, the theoretical price is your anchor. It gives you a stable reference point in the often-turbulent sea of live market prices. It's the tool that helps you move from reactive trading to making data-backed, strategic decisions.
Now that we've laid the groundwork, let's get into the nitty-gritty of the models used to actually calculate this value.
How Option Pricing Models Actually Work
So, how do we get to that "theoretical price"? What’s going on under the hood? It all comes down to a handful of mathematical models that act as our roadmap. Instead of getting lost in complex academic formulas, let's look at the two most common approaches with some simple analogies.
The two big players are the Binomial model and the Black-Scholes model. They take different routes to get there, but both are trying to answer the same question: what should this option be worth? And they both use the same core ingredients to figure it out.
The Binomial Model: A Step-By-Step Journey
I like to think of the Binomial model as a "Choose Your Own Adventure" story for a stock's price. It's wonderfully straightforward. The model chops up the time until an option expires into a series of small, distinct steps—say, daily or even hourly intervals.
At each of these steps, the stock price is only allowed to do one of two things: move up by a specific amount or move down by a specific amount. That's it. By building a "tree" of all these potential up/down paths, the model can calculate the option's value at every possible outcome on expiration day. Then, it works backward from there to find what the option should be worth today.
This step-by-step logic makes the Binomial model incredibly intuitive. It’s a fantastic way to visualize how an option's value might evolve and is particularly useful for pricing American-style options, which you can exercise at any point before expiration.
The Black-Scholes Model: A Smooth Flight Path
Now, if the Binomial model is a rugged, step-by-step hike, the Black-Scholes model is like charting a smooth, continuous flight path. Rather than plotting a series of individual up-or-down moves, it uses a single, powerful formula to calculate the probability of where the stock will end up at expiration.
This model treats the stock's price movement as a more fluid, wave-like motion. It’s famous for its speed and elegance, and it has been a cornerstone of finance ever since it was developed.
It’s hard to overstate the impact these models had. While some basic option pricing concepts existed before, everything changed when the Black-Scholes model was formally introduced in 1973. Its arrival lit a fire under the options market. To give you an idea, options volume on the CBOE exploded from around 1 million contracts in 1973 to over 1.2 billion by 2000—a mind-boggling 120,000% increase. It was a genuine financial revolution.
The Five Key Ingredients of Price
Despite their different approaches, both the Binomial and Black-Scholes models are like recipes that rely on the same five core ingredients. Tweak any one of these, and the final theoretical price will change.
Here are the essential inputs that drive the calculation:
- Underlying Stock Price: The stock's current price in the market. For a call option, a higher stock price means a higher theoretical value; for a put, it’s the opposite.
- Strike Price: The fixed price at which you can buy or sell the stock. This is the benchmark that determines if the option has intrinsic value.
- Time to Expiration: How much time is left on the clock. More time almost always equals more value, simply because it gives the stock more chances to make a big move in your favor.
- Risk-Free Interest Rate: This is what you could earn on a "no-risk" investment, like a government bond. It’s used to account for the time value of money.
- Volatility: This is the big one—the most important and subjective input. It’s a measure of how much the stock’s price is expected to swing around.
Volatility is the secret sauce. A stock that moves erratically has a greater probability of reaching an extreme price—either high or low. This uncertainty makes its options more valuable. That’s why higher volatility leads to a higher theoretical price for both calls and puts.
Getting a feel for how these five inputs interact is the real key to understanding an option's value. When you start playing with volatility assumptions or see how time decay chips away at the price, you’re using these models just like a professional trader would. It allows you to look past the market price and see the underlying mechanics of an option's worth—and that’s the first step to spotting a real edge.
Alright, enough with the theory. Let's get our hands dirty and actually calculate the theoretical price of an option using a real-world scenario. It’s one thing to know the ingredients, but seeing them come together in a recipe is what really builds confidence.
We'll walk through this step-by-step to show you exactly how it’s done.
To make this practical, let's imagine we're tracking a hypothetical stock called 'ChannelCorp Inc.' (ticker: CHNL). We're interested in it because it has a history of trading neatly within a predictable price channel—a perfect candidate for our strategy.
Setting Up the Scenario
Let's say we're eyeing a call option on CHNL. The first thing we have to do is gather the raw data. Just remember, any pricing model is only as good as the numbers you put into it. Garbage in, garbage out.
Here are the key details for our potential trade:
- Underlying Stock Price (CHNL): The stock is currently changing hands at $50.00.
- Option Strike Price: We're looking at the $52 call option.
- Time to Expiration: This option expires in exactly 30 days, which is 0.082 of a year for modeling purposes.
- Risk-Free Interest Rate: We'll peg this to the current U.S. Treasury yield, which we'll call 4%.
- Volatility: Now for the tricky one. This is always the most subjective input. Based on CHNL's past price swings, we'll estimate its historical volatility at 35%.
The process is always the same: gather your inputs, run them through a model, and get a theoretical price.
This simple three-step flow is the heart of finding an option's fair value.
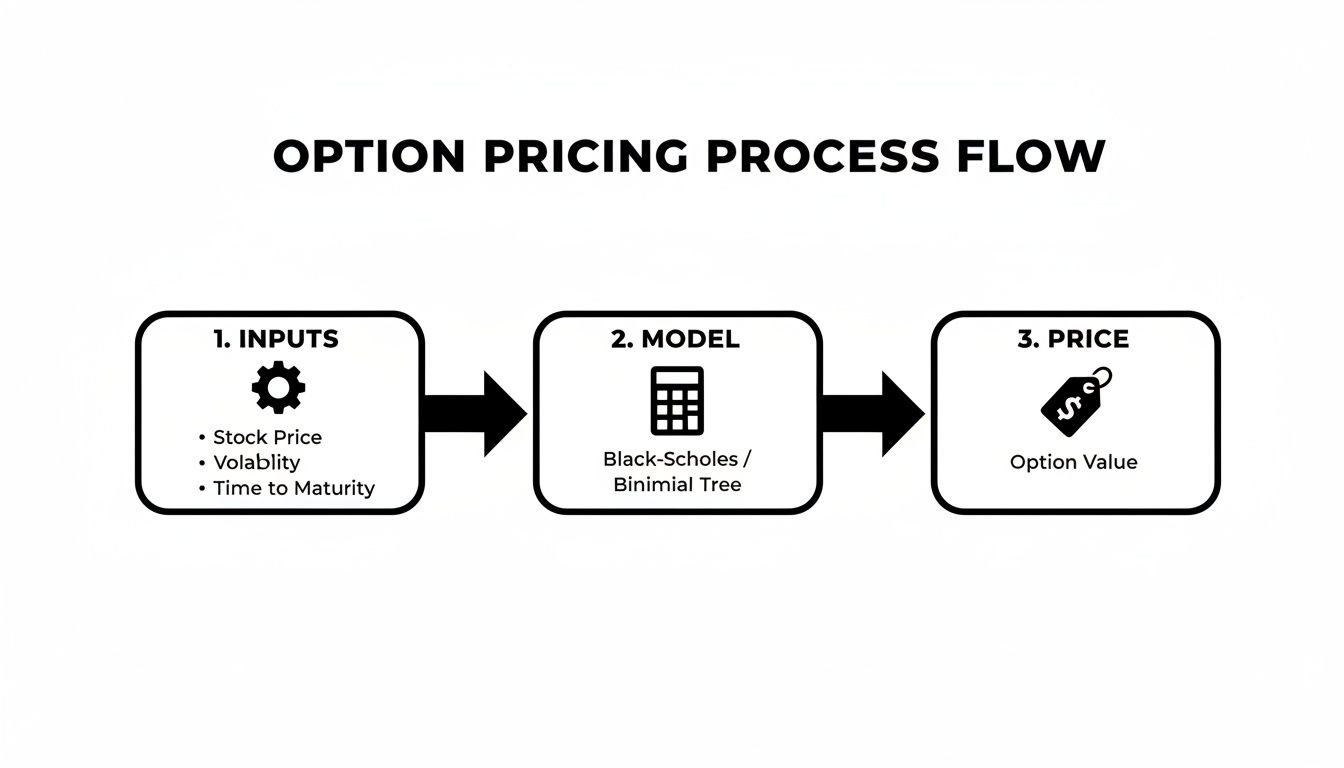
As you can see, it's a logical progression. You start with the known facts, apply a consistent formula, and arrive at a powerful estimate of what the option should be worth.
Now that we have our five key inputs, we're ready to do the math.
Running the Simplified Calculation
For this walkthrough, we'll use a simplified version of the Black-Scholes model. Don't sweat the complex calculus behind it; your brokerage platform or any decent online options calculator will do the heavy lifting in a split second. What matters is understanding the logic, not memorizing the formulas.
When we feed our five inputs into a Black-Scholes calculator, it's essentially doing two things:
- It projects thousands of possible price paths the stock could take over the next 30 days, all driven by that 35% volatility assumption.
- It then calculates the probability of the stock finishing above our $52 strike price and discounts that potential profit back to today's value using the 4% risk-free rate.
After crunching all those numbers, the model spits out a single, powerful figure.
Based on our inputs, the theoretical price of the an option for our CHNL $52 call is approximately $1.45.
What does this mean? It means that, according to our model and the specific assumptions we made, a "fair" price for this option right now is $1.45 per share. Since one contract controls 100 shares, the fair value for the contract is $145.
Interpreting the Result in a Trading Context
So, you have this $1.45 number. Now what? This is where theory meets the trading floor. This calculated value becomes your personal benchmark—your anchor of "fair value" in the often-chaotic sea of market prices.
The next step is to pull up your trading platform and look at the actual market price for this exact CHNL option. You’ll see the bid-ask spread, which shows what buyers are offering and what sellers are asking.
Let's say you see this quote:
- Bid: $1.10
- Ask: $1.20
This is where your homework pays off. The market is offering to sell you this option for $1.20, but your own analysis says it should be worth $1.45. That's a potential edge. It looks like this option is currently undervalued by the market.
On the flip side, what if the market ask price was $1.75? Your calculation would immediately flag the option as potentially overvalued, suggesting you should probably wait for a better price or look for another opportunity entirely.
This simple comparison is the entire point of using theoretical value in your trading. It elevates you from being a price-taker to a value-hunter. By running these quick calculations, you arm yourself with a data-driven reason to pull the trigger—or to practice patience. This is a fundamental skill you can sharpen over time, and a great way to start is by practicing without risking real money. You can learn more about how to do that with our guide on paper trading examples.
By consistently comparing the market price to a calculated theoretical price of an option, you start to spot discrepancies that most retail traders miss. This is your first step toward building a repeatable, strategic approach to trading options on channeling stocks.
Spotting Your Edge with Theoretical vs. Market Price
This is where all the math and theory finally pay off. Understanding an option's theoretical price isn't an academic exercise; it's about what you do with that number. You calculate what a contract should be worth and then compare it to what the market is actually charging right now.
Let's say your model spits out a "fair value" of $2.50 for a call option. You pull up your trading platform and see the bid-ask spread is hovering around $2.00. That $0.50 gap is the whole game. It's a potential inefficiency, a statistical edge you can act on.
The secret to uncovering these opportunities comes down to one crucial choice: which volatility input you use for your calculation. The answer tells you two completely different stories about the option's real value.
The Two Lenses of Volatility
When you're running a pricing model, the volatility you plug in changes everything. Think of it as looking at the market through two different lenses—one showing you the past and one showing you the future.
Historical Volatility (HV): This is your rearview mirror. It’s a purely backward-looking metric that tells you how much the stock’s price has actually bounced around over a set period, like the last 30 or 90 days. A theoretical price based on HV shows you what the option might be worth based on its proven, historical behavior.
Implied Volatility (IV): This is the market's crystal ball. It’s the volatility being implied by the option's current market price. In other words, it’s what the collective market—all the buyers and sellers—thinks the stock’s future volatility will be.
The real magic happens when you pit these two against each other. The theoretical price you calculated using HV becomes your objective baseline, which you then compare against the live market price driven by IV.
How to Identify Potential Mispricings
A potential mispricing pops up when there's a big disagreement between the market's future expectations (IV) and the stock's past reality (HV). For a swing trader, this gap is where the opportunities are born.
Take a stock heading into an earnings report. Fear and speculation often run wild, causing traders to bid up option prices and send implied volatility through the roof. The market price for those options can get completely disconnected from a theoretical price based on the stock’s normal, day-to-day price swings.
An experienced trader sees this and immediately thinks, "The market is overpaying for fear right now. These options are expensive compared to how this stock usually moves." This is a classic signal that selling premium—using a strategy like a covered call or a credit spread—could be a high-probability trade.
On the flip side, you might see a stock stuck in a boring, quiet channel. Complacency sets in, and implied volatility can drop to rock-bottom levels. Here, options might look cheap compared to their historical volatility baseline. This can signal a great time to buy potentially undervalued options, positioning yourself for a breakout.
A Real-World Example of an Edge
Using theoretical price gives you a concrete benchmark to quantify your trading edge. In one analysis, a call option on Microsoft (MSFT) had a theoretical value of just $0.37 when calculated using its historical volatility. At the same time, the live market was pricing that same option between $0.81 and $0.83.
That's a massive $0.54 gap, suggesting the market was significantly overvaluing the option. Anyone buying that call would be paying a huge premium over its historical "fair value." As a detailed breakdown of this trade shows, while historical data suggested the stock would move past the break-even point 48.1% of the time, the high premium paid meant the actual win rate for the trade was only 33.3%.
This is the perfect illustration of the concept. A theoretical price based on historical data gives you an objective benchmark, completely separate from the market's current emotion. Learning to spot that gap is how you shift from simply following price charts to actively exploiting value discrepancies.
Practical Applications for Swing Traders
Alright, enough with the theory. Let's talk about how the theoretical price of an option actually puts money in your pocket. For a swing trader who lives and breathes channeling stocks, this isn't just an academic concept—it's a tool for gaining a statistical edge on every single trade. It’s where your chart reading skills meet smart value assessment.
Think about a stock you've been watching that pulls back to a strong support level at the bottom of its channel. That's your classic entry signal. But instead of just buying shares, you can take it a step further. You can scan for call options that are trading below their theoretical value.
When you do this, you're stacking the odds in your favor. You're not only entering a trade at a technically sound price point but also buying an instrument the market might have temporarily mispriced. That built-in discount can dramatically improve your risk-reward ratio.
Finding Opportunities at Channel Boundaries
The best part? This works both ways. The exact same logic applies when the stock rallies to the top of its channel and approaches a tough resistance level where you're expecting it to reverse.
As the price gets near that ceiling, you can start hunting for put options. Your mission is to find puts that seem cheap compared to their fair value, as calculated by your model. Snagging an undervalued put option right at a major resistance point is a high-probability setup for profiting from the swing back down.
The strategy really boils down to this: Use your charts and technical patterns to figure out when to trade. Use theoretical price analysis to figure out what to trade. When you combine the two, you create a powerful, repeatable process.
This approach keeps you from overpaying for options that are pumped up by greed or fear. By grounding your decisions in a calculated "fair price," you're forcing yourself to be disciplined and trade with a quantifiable edge.
Actionable Paper-Trading Exercise
The only way to get comfortable with this is to practice without real money on the line. Going through the motions helps you build an intuitive feel for how market prices drift away from theoretical values as a stock bounces between its channels. To get some reps in a safe environment, check out our detailed guide on how to paper trade options.
Here's a simple drill to get you started:
- Pick a Stock: Grab a stock from a list of good channeling candidates—one with well-defined support and resistance.
- Calculate the Fair Value: Choose a slightly out-of-the-money call option with about 30 days left until expiration. Use a pricing model to figure out its theoretical price based on its historical volatility.
- Track the Gap: Every day, jot down the option's live market price (the ask) and compare it to your calculated value. See how the gap between the two prices shrinks and grows.
- Watch the Key Levels: Pay extra close attention when the stock approaches its support or resistance. Does the option's market price get closer to its theoretical value, or does it drift further away?
- Review and Repeat: At the end of the week, look at your notes. Did the option ever trade at a significant discount to its theoretical price? When did that happen? Now, do it again with a different stock or in different market conditions.
This kind of hands-on work is priceless. It takes the theoretical price of an option from a fuzzy concept and turns it into a concrete tool you can use. You’ll learn to spot potential mispricings in real time, giving you a serious advantage that most traders completely miss.
Where The Models Break Down
It’s easy to get mesmerized by the mathematical elegance of option pricing models. But make no mistake: they aren't crystal balls. These models are built on a set of neat, tidy assumptions that the real world loves to trample all over.
Think of a model like Black-Scholes as assuming a perfectly straight road with no traffic and constant speed. In reality, the market is a chaotic city street full of sudden stops, irrational drivers, and unexpected detours. Human emotion—greed and fear—is the ultimate driver, and volatility is never, ever constant.
When Theory Gets Mugged by Reality
So, when do these clean calculations fall apart? You see it all the time.
Consider a stock just hours before an earnings report. The air is thick with uncertainty. Is it a beat? A miss? This "known unknown" sends implied volatility through the roof, pumping up option premiums far beyond what any model using historical data would ever suggest is "fair."
This isn't an isolated phenomenon. The models routinely break during:
- Sudden geopolitical shocks or surprise interest rate announcements.
- Major market panics or so-called "black swan" events.
- Game-changing news for a single company, like a buyout offer or a clinical trial failure.
In these moments, the market price isn't about fair value. It's about raw speculation, hedging, and panic. The theoretical price of an option is a useful guide, but it's just a guide—never the gospel.
A pricing model is only as good as the numbers you feed it. And the most critical, most subjective number of all is your guess for future volatility. Tweak that one input just a little, and the entire "fair value" calculation can change dramatically.
Keeping Your Analysis Grounded
At the end of the day, theoretical value is a powerful supplement to your trading strategy, not a replacement for it. It shines brightest when you combine it with sharp technical analysis and disciplined risk management.
The data backs this up. In normal times, theoretical prices calculated with historical volatility tend to fall somewhere within 10-20% of the bid-ask spread. But conditions matter. Throughout the low-volatility environment of 2025, analysis showed S&P 500 theoretical calls were often undervalued by 12.4%, while puts appeared overvalued by 18.2% during the Fed’s rate hike cycles.
This constant tug-of-war is what makes the market. Theta decay is always there, quietly eating 1-2% of an option's extrinsic value every single day, pulling the market price down. That is, until a volatility event—like the VIX spiking to a staggering 82.69 in March 2020—shatters all expectations and sends prices soaring. You can explore more detailed option price data to see these forces in action for yourself.
Understanding these limits is what separates the novices from the pros. Use the models, but trust your judgment and your analysis more.
Common Questions About an Option's Theoretical Price
Once you start digging into theoretical pricing, a few key questions always pop up. It's only natural. Let's clear the air on the most common ones so you can start using this concept with confidence.
Which Volatility Should I Use?
That's the million-dollar question, isn't it? The truth is, there’s no single “right” volatility to use—they each tell you a different part of the story.
Historical volatility (HV) gives you a price based on what the stock has actually done. Think of it as the "show me the proof" value, grounded in the stock's proven track record of movement. It answers the question, "What would this option be worth if the stock just keeps being itself?"
Implied volatility (IV) shows you what the market thinks is going to happen next. It's the price of fear, greed, and anticipation baked right into the option premium. When IV is high, the market is expecting fireworks, making options look pricey.
The real trick is to use them together. Calculate a theoretical price with HV to establish your own objective benchmark. Then, compare that number to the actual market price, which is being driven by IV. That comparison is where you'll find potential trading edges.
Can I Rely Solely on Theoretical Price?
In a word: no. While it's an incredibly powerful tool for spotting potential mispricings, the theoretical price is a guide, not a gospel.
Think of the theoretical price as the speedometer on your car. It gives you crucial information, but you wouldn't drive with your eyes glued to it. You still need to look at the road, check your mirrors, and obey traffic signals.
In trading, this means combining your value analysis with chart patterns (like channeling stocks) and, above all, a non-negotiable risk management strategy. Acting on a "cheap" option while ignoring the bigger technical picture is a classic rookie mistake.
How Often Should I Recalculate It?
You’ll want to refresh the theoretical price whenever its core ingredients change. Since the stock price moves and time ticks away every single trading day, getting into the habit of a daily recalculation is a smart move.
Even more critical, however, is to recalculate it immediately after a major volatility event. A sudden spike or collapse in volatility is the single most powerful force that can warp an option's price. Keeping your numbers fresh ensures your analysis isn't based on stale, irrelevant data. For a deeper dive into these and other terms, our comprehensive trading glossary is a great resource.
At Channeling Stocks, we provide the data and educational tools to help you identify these opportunities consistently. Stop guessing and start trading with a data-driven edge.
Start your 14-day free trial today!