
Finding the right stocks to swing trade isn’t about luck or hot tips. It’s about building a repeatable process that consistently surfaces high-probability setups. Think of it as a three-part system: you define your strategy, build a targeted stock screener, and then validate every candidate with rigorous chart analysis.
This framework is what separates disciplined traders from the crowd. It filters out the noise and keeps you focused on opportunities that actually fit your personal style and risk tolerance.
Build Your Swing Trading Foundation
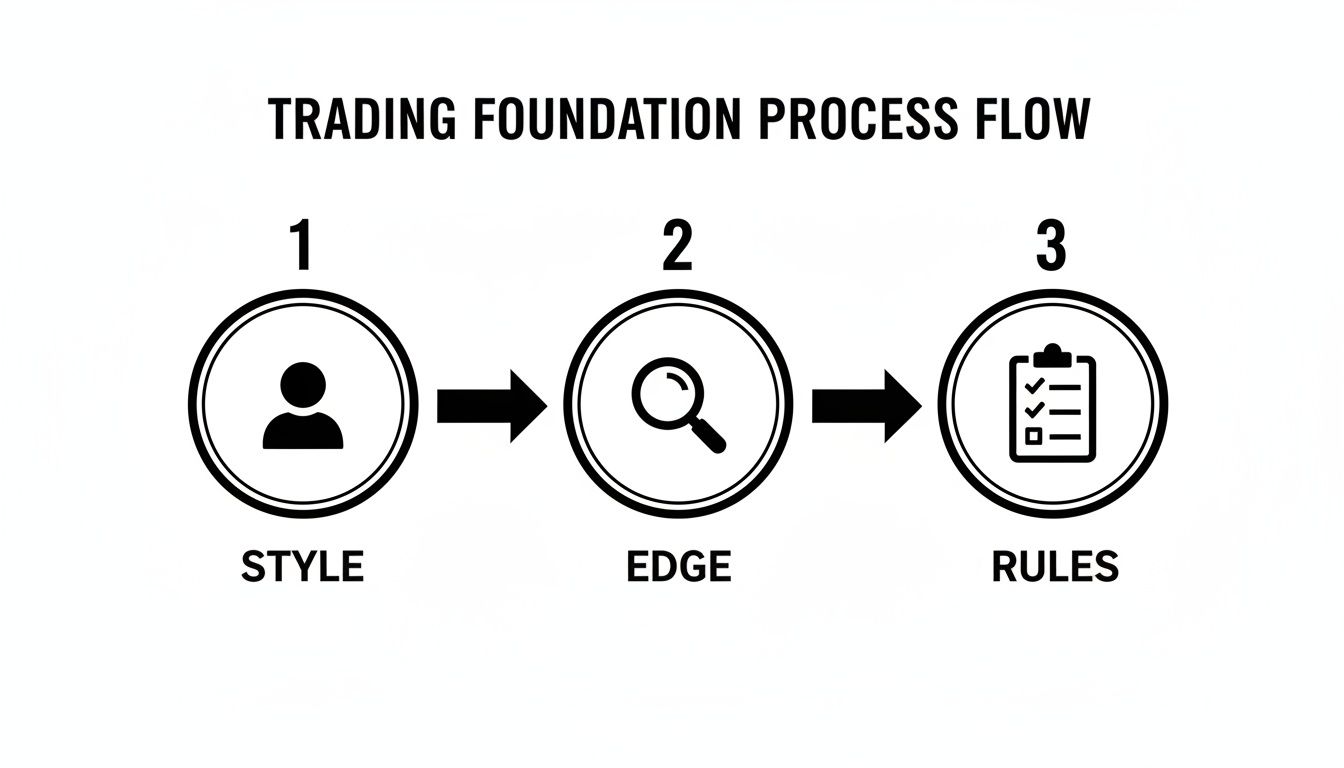
Before you even think about running a stock scan, you need to lay the groundwork. I’ve seen countless traders fail because they jump from one shiny object to the next without a plan. That’s a recipe for disaster.
A solid foundation is your personal business plan for trading. It keeps you from making emotional decisions in the heat of the moment and is the real secret to finding setups that work for you. This isn’t about stocks yet; it’s about defining yourself as a trader.
What’s Your Timeframe?
First things first: what’s your ideal holding period? This one decision changes everything.
Are you looking for quick pops, holding a stock for just 2 to 5 days to capture a burst of momentum? Or do you have the patience for a bigger move, holding for 1 to 4 weeks as a larger swing unfolds?
A shorter timeframe naturally pushes you toward more volatile stocks, where price moves quickly. A longer hold period is often better suited for stocks in steadier, more predictable trends. There’s no “right” answer here. It has to match your schedule, personality, and what you’re comfortable with.
What’s Your Edge?
Every successful trader has an “edge”—a specific, repeatable market condition they know how to exploit. Most new traders try to be a jack-of-all-trades and master of none. The pros, however, usually master just one or two powerful setups.
Your edge is what gives you a statistical advantage. For instance, you might:
- Become an expert at spotting a specific chart pattern, like clean price channels or bull flags.
- Get really good at identifying which sectors are attracting money and then finding the strongest stocks in that group.
- Learn to follow the “smart money” by tracking unusual volume spikes that signal big institutions are buying in.
The key is to find a niche you understand deeply and stick with it. An edge doesn’t need to be complex; it just needs to be consistent and something you can execute with confidence.
Put Your Rules in Writing
Now, document everything. This sounds simple, but it’s the step most people skip. Your trading plan is your constitution—it holds you accountable when the market is trying to pull you in a dozen different directions.
It should be clear, concise, and written down. Before you even think about placing a trade, you should be able to glance at your plan and know exactly what to do.
This foundational work acts as a filter. Every stock you consider from now on must pass through this personal system. Once you have this framework locked in, you’re ready to stop planning and start hunting for real opportunities.
How to Build Your High-Probability Stock Screener
Alright, with your trading plan in place, it’s time to go hunting. This is where a stock screener becomes your best friend. Think of it as your secret weapon for sifting through the entire stock market—all thousands of companies—to find a handful of real, actionable swing trading opportunities.
The goal isn’t to find the “perfect” stock. Instead, we’re going to systematically kick out the thousands of stocks that are a terrible fit for our strategy. By zeroing in on a few non-negotiable criteria, we can stack the odds in our favor and find stocks that are actually primed to move. This repeatable process is what separates focused traders from those who spend hours just flipping through random charts.
Start with the Non-Negotiable Filters
First things first, we need to apply a few filters that immediately disqualify any stocks that are fundamentally untradeable for a swing trader. These are the absolute basics that ensure a stock has enough liquidity and at least some institutional attention. Consider them the gatekeepers for your watchlist.
You don’t need fancy, expensive software for this. A powerful free tool like Finviz has everything you need to get started.
Here are the foundational filters I always begin with:
- Market Cap: Greater than $300 million. This gets rid of the tiny, erratic micro-cap stocks. They’re too easily manipulated and often have terrible liquidity.
- Price: Above $10 per share. Stocks trading below this level are often much more volatile, face delisting risks, and are generally avoided by big-money investors.
- Country: USA. By focusing on one market, you simplify everything. You’re dealing with regulations and reporting standards you understand.
These three simple rules instantly slash the list of potential stocks from over 8,000 to a much more focused group, cutting out a huge amount of noise right away.
Layer on Liquidity and Trend Filters
Once we’ve cleared out the junk, the next step is to make sure we can actually trade the stocks that are left. A beautiful chart pattern is worthless if you can’t get in and out of your position cleanly and without paying a huge penalty on the spread. This is where liquidity and trend come in.
That brings us to one of the most important metrics for any trader: average daily volume. This simply tells you, on average, how many shares are traded each day. A stock with low volume will have wide bid-ask spreads and you’ll likely suffer from slippage—the frustrating gap between the price you clicked and the price you actually got.
For my swing trades, I won’t even look at a stock trading less than 1 million shares a day. That level of liquidity is crucial for getting in and out of a trade quickly when you’re targeting those quick 2-5% gains. It’s a simple filter that drastically improves your odds.
A stock screener isn’t about finding hidden gems. It’s a tool for systematic elimination. Your job is to disqualify bad candidates so you can focus your time on analyzing the few high-probability setups that remain.
Finally, we need to confirm the stock is in a healthy uptrend. We do this by adding a couple of simple moving average filters. A stock trading above its key moving averages is a sign of strength and positive momentum, giving us a nice tailwind for our trade.
Your Trend & Liquidity Filters:
- Average Volume (3 Month): Over 1 million. This is our non-negotiable liquidity checkpoint.
- Price: Above the 50-Day Simple Moving Average (SMA). This confirms the stock is in a solid intermediate-term uptrend.
- Price: Above the 200-Day Simple Moving Average (SMA). This shows us the stock has strong long-term momentum, which is exactly what we want to be trading with.
By adding these layers, you’ve now built a powerful screener that hunts for liquid stocks in confirmed uptrends. This is an incredible starting point that will consistently deliver a focused list of strong candidates. To see other platforms and more advanced filters, check out our guide on the best stock screeners for swing trading. This process becomes your assembly line for finding great trade ideas, day in and day out.
Find Momentum with Sector and Relative Strength Analysis
A good stock screener will give you a list of decent candidates. But if you want to find explosive trades, you need to layer on momentum analysis.
Here’s a hard truth of trading: a mediocre stock in a hot sector will almost always run further and faster than a great stock in a forgotten one. It’s just easier to swim with the current than to fight against it.
This is a top-down approach that helps you see where the big institutional money is flowing. By pinpointing the leading industries first, you find a natural tailwind for your trades. It’s a crucial step many retail traders skip, but it’s a cornerstone of how professionals find high-probability setups again and again.
Identify the Strongest Sectors
Before you even think about looking at individual stock charts, you need to zoom out. Your first goal is to figure out which sectors—like technology, healthcare, or energy—are clearly outperforming the rest of the market.
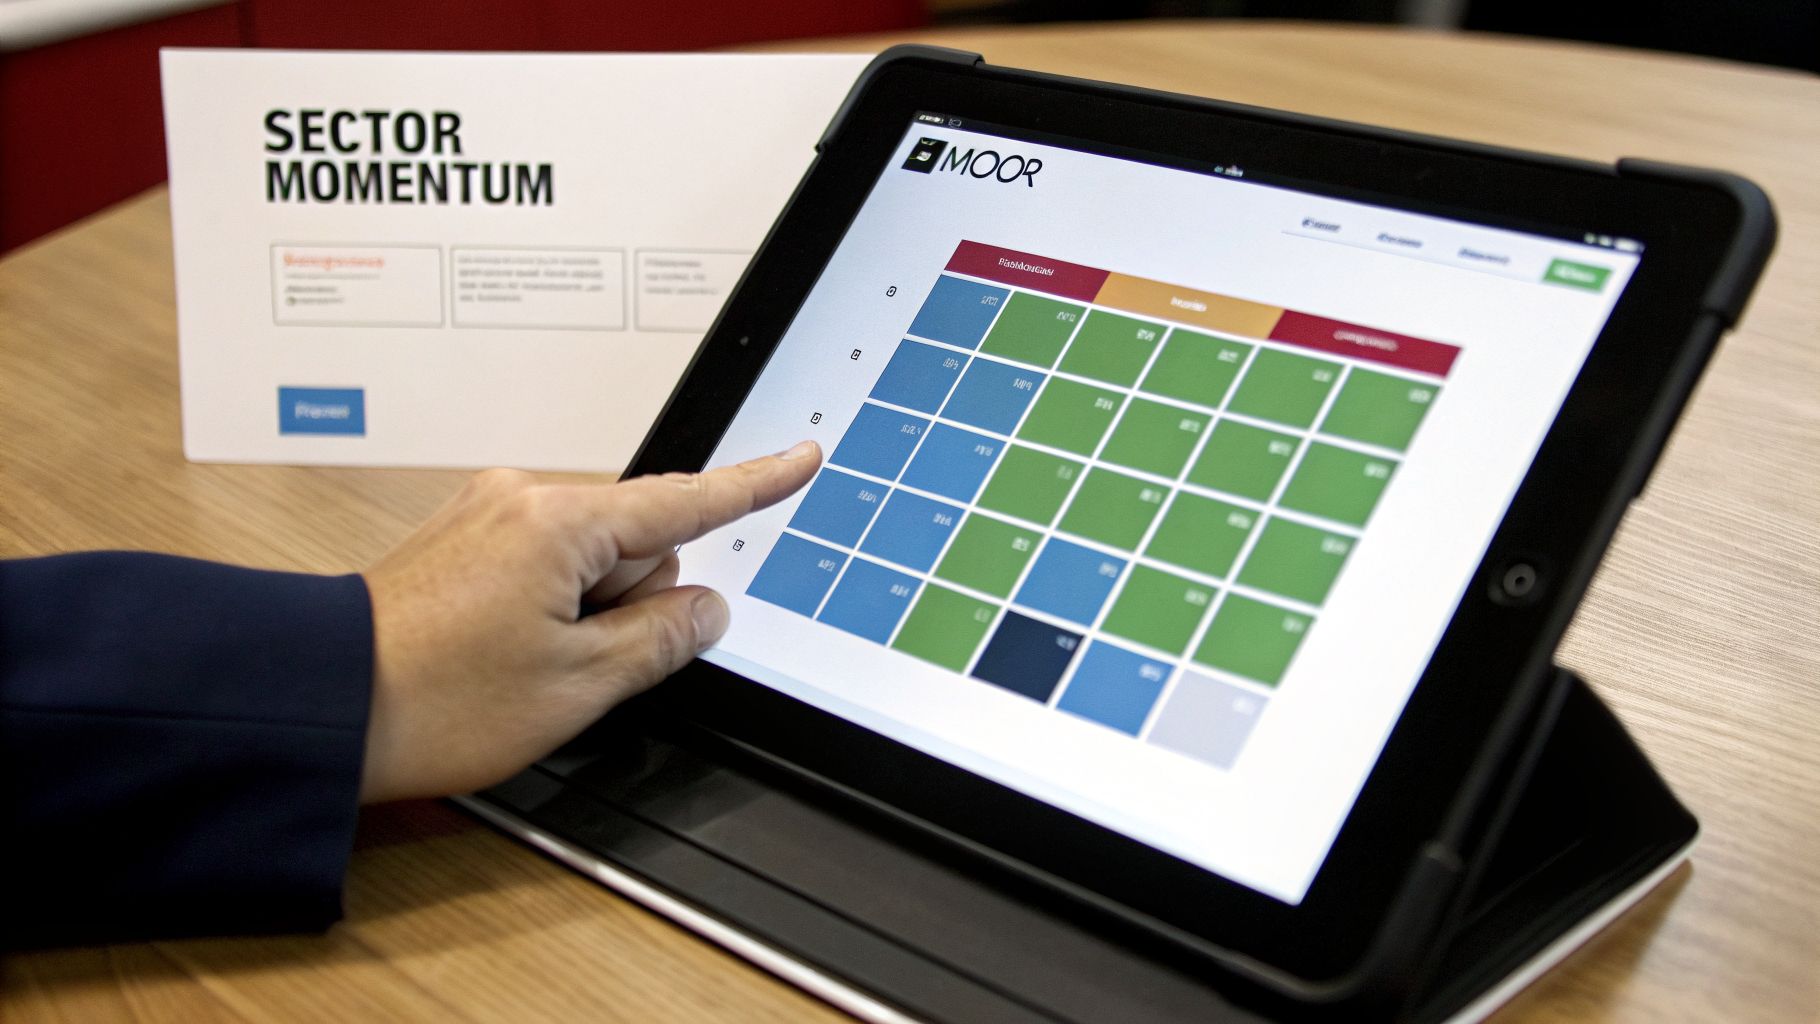
An easy and surprisingly effective way to do this is with a sector ETF heatmap. I use the free one on Finviz all the time. It gives you an instant visual on sector performance across different timeframes. You can immediately spot what’s “hot” (bright green) and what’s “cold” (bright red).
For swing trading, I’m almost always focused on the 1-month and 3-month performance. This shows sustained momentum and filters out the day-to-day noise. If the technology sector (XLK) is up 8% over the last month while utilities (XLU) are down 2%, you know exactly where to begin your hunt.
Your job as a swing trader isn’t to predict the next hot sector. It’s to identify which sectors are already showing strength and ride that wave.
Drill Down to Find the Leaders
Once you’ve nailed down two or three of the strongest sectors, it’s time to find the leaders within those groups. Not every stock in a hot sector is a winner. We’re looking for the “leaders of the pack”—the stocks that are outperforming both their industry peers and the broader market, like the S&P 500.
This is what traders call relative strength. A stock with high relative strength is like the star player on an all-star team. It’s already showing incredible momentum and is far more likely to make a big move.
You can measure this by simply comparing a stock’s price chart against its sector ETF or the SPY (the S&P 500 ETF). Most good charting platforms have a relative strength indicator, often labeled “RS” or displayed as a ratio line comparing two symbols. If that line is trending up, it means your stock is outperforming.
This is why sector rotation is a swing trader’s best friend. For example, when the tech sector ETF XLK surged in 2026, some of the top swing stocks inside delivered incredible short-term returns. This highlights the power of finding leaders in strong groups, a topic VectorVest covers well in their blog about finding stocks for swing trading.
Combine Relative Strength with Your Screener
Now, you bring it all together. Take that list of potential trades from your screener and start cross-referencing it with your sector work.
Ask these questions for every candidate:
- Is this stock in one of the top-performing sectors I identified?
- Is it showing strong relative strength against the S&P 500?
This is how you refine your watchlist and dramatically stack the odds in your favor. You’re no longer just trading a random stock in an uptrend; you’re trading a strong stock, in a strong sector, that is also outperforming the entire market.
This multi-layered confirmation is a core part of understanding the broader direction of the market before you ever risk a dollar.
Confirm Setups with Key Chart Patterns and Technicals
Your screener and sector analysis have done the heavy lifting, narrowing a universe of thousands of stocks down to a manageable list. This is your pool of candidates. But a list from a screener is just a starting point, not a buy signal. Now, the real work begins—the manual chart review.
This is where the rubber meets the road. A screener gives you the what (liquid stocks in an uptrend), but the chart tells you the when and how. This is where you visually confirm that a setup is clean, predictable, and ready for a trade. Without this critical step, you’re essentially flying blind.
Spotting Stocks in Clean Channels
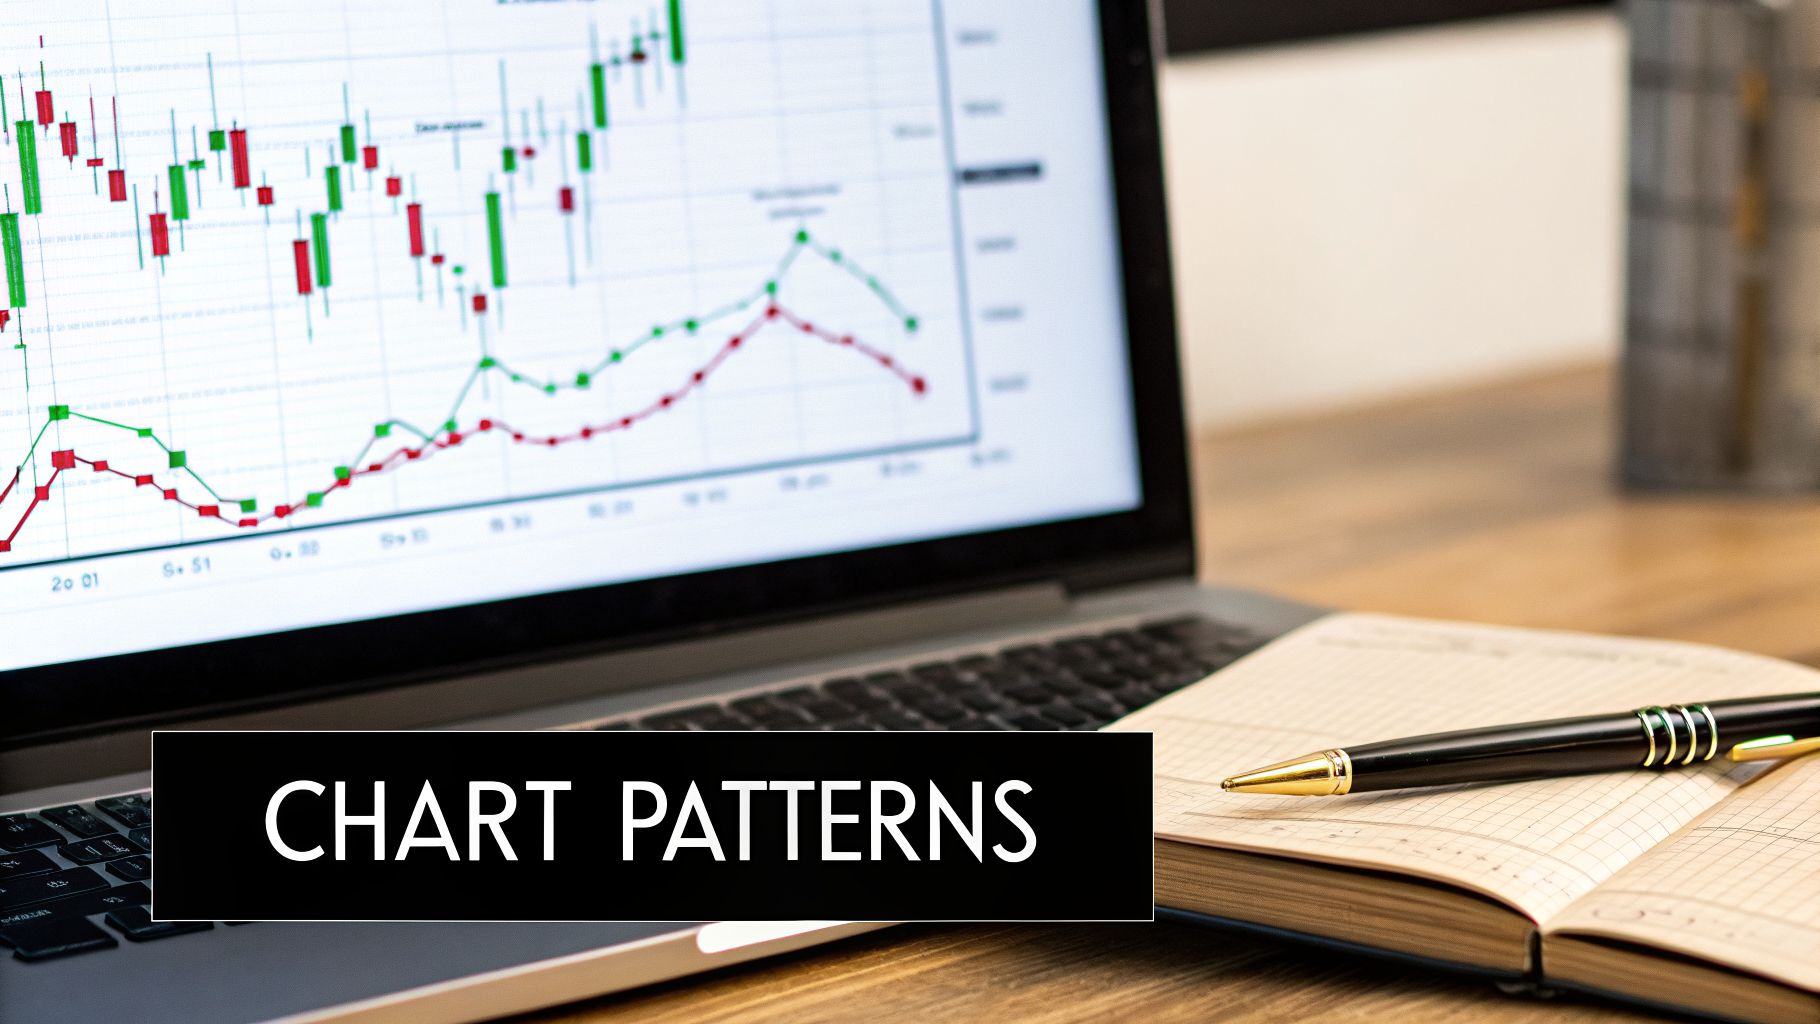
One of the most reliable patterns for swing traders, especially when you’re starting out, is a simple price channel. Think of it as a stock trading in a predictable, upward-sloping hallway. The price bounces neatly between a lower trendline (support) and an upper, parallel trendline (resistance). It’s a beautiful, visual map of a controlled uptrend.
Finding them is straightforward. Pull up a chart for one of your screened stocks and look for at least two distinct swing highs and two swing lows. Grab your charting platform’s trendline tool, connect the lows to define your support line, and then draw a parallel line connecting the highs.
If the price action respects these boundaries, you’ve found a stock that’s channeling. The elegance is in its simplicity: you’re looking to enter near support and take profits as it approaches resistance.
Validating the Strength of a Pattern
But here’s the catch—not all channels are created equal. A messy, ill-defined pattern is more of a trap than an opportunity. Before a stock even thinks about making it to my final watchlist, I need to vet the quality of the pattern itself. A high-probability setup has a few tell-tale signs.
Here’s what I look for to separate the A+ setups from the C- failures:
- Multiple Touches: How many times has the price tested the support and resistance lines? A pattern with three or more confirmed touches on each line is exponentially more reliable than one with just two. Every touch reinforces the pattern’s validity.
- Clean Bounces: When the price hits support or resistance, does it react sharply, or does it chop around indecisively? You want to see the price approach a level, test it, and then move away with conviction. Messy price action is a red flag.
- Volume Confirmation: Always check the volume bars. Ideally, you’ll see volume pick up as the price bounces off support (a sign of buyers stepping in with force) and then diminish as it drifts back toward resistance.
A great chart pattern should feel obvious. If you have to squint, tilt your head, and force the lines to fit, it’s not a strong setup. The best trades often jump right off the screen at you.
Recognizing Other Classic Swing Patterns
While channels are my bread and butter, they aren’t the only pattern in the playbook. As you clock more hours in front of the charts, you’ll start to recognize other formations that signal a trend is likely to continue. These patterns typically represent a brief pause—a consolidation period—before the stock makes its next move higher.
A few key patterns every swing trader should have in their arsenal are detailed in the table below.
Key Swing Trading Chart Patterns
This quick reference guide can help you spot and interpret some of the most common chart patterns you’ll encounter as a swing trader.
| Pattern Name | What It Looks Like | What It Indicates | Best Entry Point |
|---|---|---|---|
| Flags and Pennants | A short, rectangular (flag) or triangular (pennant) consolidation after a sharp, flagpole-like move up. | A brief pause before the prior uptrend resumes. | On a breakout above the top of the flag or pennant, ideally on increased volume. |
| Pullback to Moving Avg. | A stock in a strong uptrend pulls back to touch a key moving average, like the 20-day or 50-day SMA. | The moving average is acting as dynamic support. | As the stock bounces off the moving average and starts to turn back up. |
| Cup and Handle | A "U"-shaped rounding bottom (the cup) followed by a slight downward drift in price (the handle). | A powerful bullish continuation pattern. | On a breakout above the resistance line formed by the top of the handle. |
| Ascending Triangle | A flat upper resistance line with a rising lower trendline of support, creating a triangle shape. | Buyers are getting more aggressive, pushing lows higher. | On a decisive breakout above the flat upper resistance level. |
You can dive deeper into one of the most powerful setups in our detailed guide on Cup and Handle patterns.
This manual review is what transforms a generic list from your screener into a focused, high-confidence watchlist. You’re no longer just reacting to numbers; you’re learning to read the story of supply and demand on the chart. By confirming each setup with a clear pattern and validating its strength, you give every potential trade a sound, logical foundation.
Crafting Your Watchlist and Trading Routine
Pinpointing great trade setups is one thing, but consistency is a different beast altogether. Lasting success in swing trading isn’t built on a handful of spectacular wins. It’s forged in the fires of a disciplined, repeatable routine that brings structure to the market’s inherent chaos.
This is where you weave all your research, screening, and charting into a sustainable workflow. The goal is simple: make calm, rational decisions when you’re not under the gun of a live market. By doing most of the heavy lifting before the opening bell or after the close, you stop reacting and start anticipating. This final piece of the puzzle is what truly cements your entire process.
The Art of the Focused Watchlist
Your screener might spit out 30 potential stocks, and maybe your sector analysis trims that list to 15. But here’s a hard truth: you can’t effectively track, let alone trade, that many tickers at once. The final cut is creating a highly curated watchlist—a short, focused list of no more than 5 to 10 stocks that represent the absolute best setups you’ve uncovered.
This is your A-list. These are the candidates that have survived every one of your filters.
- They fit your core criteria for price, volume, and market cap.
- They’re swimming in strong sectors and showing high relative strength.
- Their charts are clean, clear, and display a high-probability pattern you know how to trade.
By deliberately narrowing your focus, you develop an almost intuitive feel for each stock on your list. You start to recognize its rhythm, its favorite support and resistance spots, and how it behaves on news. That’s far more powerful than trying to juggle dozens of names you barely know.
A watchlist isn’t a “buy list.” It’s a “ready list.” These are the only stocks you’ll even consider trading, and only if they hit your pre-defined entry trigger.
Building a Daily and Weekly Rhythm
A solid routine is your best defense against emotion and decision fatigue. It’s a checklist that ensures you cover all your bases and are always prepared for what the market might throw at you. The best part? You can get this entire process done in under an hour a day.
Your Evening Routine (30-45 minutes)
This is where the real work happens, after the market closes and the noise dies down.
- Run Your Scans: Fire up the screener you built to get a fresh list of potential candidates for the next day.
- Check the Sectors: Pull up a heatmap or sector summary to see where the money was flowing—or fleeing—today and this week.
- Chart Time: Manually flip through the charts from your scan. This is where you apply your trained eye, looking for those specific patterns and confirmations we’ve covered.
- Build Tomorrow’s Watchlist: Cull the list down to your top 5-10 setups. For each one, write down your exact entry price, stop-loss, and at least one profit target. Get it on paper (or a digital note) so it’s concrete.
Your Morning Routine (10-15 minutes)
The morning is for quick confirmation, not deep analysis. The plan is already set.
- Check Futures: Get a quick read on the market’s mood. Are we looking at a gap up or down at the open?
- Review the Watchlist: Glance at the pre-market action for your chosen stocks. Is there any overnight news that could wreck your setup?
- Set Your Alerts: Plug price alerts into your trading platform at your predetermined entry points. Now you’re free. Instead of staring at screens, you can let the platform tell you when it’s time to act.
Practice on Paper, Win with Real Money
Before you even think about putting a single dollar on the line, you need to validate this entire process through paper trading. This isn’t a game; it’s a full dress rehearsal using a simulated account with realistic data but zero financial risk. Many platforms, including specialized tools like Channeling Stocks, offer paper trading for this exact purpose.
Think of it as a flight simulator for your trading career. It’s where you:
- Stress-Test Your Strategy: Does your system for finding and trading stocks actually generate an edge? Paper trading gives you the data to prove it.
- Refine Your Rules: You’ll quickly find the little cracks in your entry or exit rules that need patching.
- Build Rock-Solid Discipline: This is where you practice honoring your stop-loss without hesitation, even when the trade feels like it might turn around.
Your goal should be to execute at least 50 to 100 paper trades, following your routine to the letter. Log every single trade in a journal and be brutally honest when you analyze the results. Once you can prove to yourself that you are consistently profitable on paper, you’ll have earned the confidence to trade with real capital.
Your Questions About Finding Swing Stocks Answered
As you start building your swing trading routine, a lot of the same questions tend to pop up. Let’s tackle some of the most common hurdles I see traders face, clearing the air so you can move forward with a solid plan.
Can I Do This With a Full-Time Job?
Absolutely. In fact, swing trading is perfect for someone with a demanding 9-to-5. Unlike day trading, you don’t have to be chained to your screen all day.
You can do all your heavy lifting in about 30-45 minutes each evening, long after the market has closed. This is your time to run scans, analyze your charts, and build a small, high-quality watchlist for the next day. Come morning, you only need 10-15 minutes to check for any major overnight news and set your price alerts. It’s a structured routine that fits neatly around a busy schedule.
Swing trading is about calm, pre-planned execution, not frantic, real-time reactions. The work is done when the market is closed, allowing you to go about your day without the stress of watching every tick.
How Much Money Do I Need to Start?
This is the big one, isn’t it? The good news is you probably need less than you think. A common myth is that you need a huge account to get started, but the truth is, position sizing is far more important than your starting capital. It’s not about how much money you have—it’s about how much you risk on each trade.
The golden rule is to never risk more than 1% to 2% of your account on a single idea.
Here’s what that looks like in practice:
- On a $5,000 account, a 1% risk means your maximum loss on one trade is $50.
- On a $10,000 account, a 1% risk is $100.
Your first goal isn’t to get rich; it’s to prove you can follow your process consistently. Start small, learn the ropes, and build discipline. You can always add more capital once you’ve proven your strategy works.
What Are the Biggest Mistakes to Avoid?
Nearly every new trader stumbles over the same few mistakes. Just knowing what they are puts you way ahead of the curve.
- Chasing “Hot” Stocks: Don’t get suckered into buying a stock after it has already gone parabolic. By the time it’s trending on social media, you’re almost certainly late to the party, and the risk of a nasty reversal is sky-high. Stick to your own watchlist.
- Ignoring Market Context: A perfect-looking chart setup in a crashing market is a low-probability bet. Always get a feel for the market’s overall health first. For instance, is the S&P 500 trading above its 50-day moving average? Don’t try to swim against a powerful tide.
- Failing to Have an Exit Plan: This is non-negotiable. Before you even think about hitting the “buy” button, you must know two prices: your stop-loss (where you’ll get out if you’re wrong) and your profit target (where you’ll take gains). Trading without an exit plan isn’t trading—it’s gambling.
How Many Stocks Should I Trade at Once?
It’s incredibly easy to get overwhelmed when you’re just starting out. A great rule of thumb is to limit your active trades. For a beginner, holding no more than 2 to 4 positions at a time is a fantastic starting point.
This keeps things manageable and allows you to give each trade the attention it deserves. Once you’re more comfortable, you might slowly increase to 5-8 positions. But in the beginning, simplicity is your best friend.
Ready to stop guessing and start trading with a proven system? Channeling Stocks provides curated watchlists of stocks trading in predictable channels, saving you hours of research. Our platform offers the educational tools and paper trading environment you need to build confidence and master your swing trading routine. Start your two-week free trial today.
Frequently Asked Questions:
Is swing trading profitable for beginners?
Yes, swing trading can be profitable for beginners who follow a structured risk strategy. Consistency depends on managing downside exposure, controlling position sizes, and maintaining strict trading discipline.
How to pick stocks for swing trading?
To learn how to pick stocks for swing trading, screen for liquid equities with high daily volume. Focus on stocks displaying clear price trends and solid chart patterns near support zones.
Which indicators work best for stock selection?
Traders commonly rely on moving averages, volume spikes, and trendlines. These technical tools help verify market momentum, identify potential breakouts, and pinpoint optimal entry points.
How long should swing trades be held?
A swing trade usually lasts between two days and a few weeks. The holding timeframe varies based on price targets, market volatility, and personal risk management rules.