
Before you even think about placing a trade, there’s one question you have to answer: which way is the market headed? Getting this right is the single most important factor that separates disciplined trading from pure guesswork.
What Is the Direction of the Market and Why It Matters
Think of the market as a powerful river. Trying to paddle upstream against a strong current is exhausting, inefficient, and you probably won’t get very far. But if you turn your boat around and go with the current, the journey is almost effortless.

Trading works the exact same way. Aligning your trades with the direction of the market—its primary trend—massively stacks the odds in your favor. Fighting the trend is a recipe for frustration and loss.
These trends aren't just random, short-term blips; they reflect the collective mood of investors and the health of the broader economy. For instance, the sheer power of an uptrend was on full display when the total value of global stock trading rocketed from $75.07 trillion in 2019 to a staggering $120.65 trillion in 2021. You can dig deeper into these massive shifts with these stock trading statistics.
The Three Core Market Directions
When you strip away all the noise, the market can only really do one of three things. Your first job as a trader is to figure out which one it is.
- Uptrend (Bullish): The market is consistently carving out a series of higher highs and higher lows. This is your strong, upward-flowing river current.
- Downtrend (Bearish): You'll see a clear pattern of lower highs and lower lows. Here, the current is pulling prices down.
- Sideways (Ranging): Price is bouncing between a well-defined floor (support) and ceiling (resistance), going nowhere fast. Think of this as a calm, meandering part of the river.
By identifying which of these three states a stock is in, you immediately gain a strategic advantage. It tells you whether to look for buying opportunities, selling opportunities, or simply to wait on the sidelines for a clearer signal.
To make this even clearer, here’s a quick breakdown of how to think about each market direction.
The Three Market Directions at a Glance
| Market Direction | Key Characteristic | Primary Trading Strategy |
|---|---|---|
| Uptrend | Higher highs and higher lows | Buy on pullbacks to support |
| Downtrend | Lower highs and lower lows | Sell on bounces to resistance |
| Sideways | Trading in a horizontal range | Buy at support and sell at resistance |
This simple framework is your starting point. Once you can correctly identify the market's trend, you're no longer just reacting—you're trading with a plan.
Essential Indicators for Gauging Market Direction
So, you know the market has a general direction, but how do you actually measure it with any real confidence? It's one thing to have a hunch; it's another to have data backing you up. Just like a pilot relies on instruments, not just the view out the window, traders use technical indicators to get a clearer read on the market's currents. These tools help us cut through the noise.

While you could get lost in a sea of hundreds of different indicators, I’ve found that a few tried-and-true tools are all you really need. We’re going to focus on three essentials that work beautifully together to confirm the trend, its momentum, and the strength behind it.
Moving Averages: The Market's Compass
First up is the moving average (MA). This is one of the most foundational indicators for a reason. It simply smooths out the chaotic day-to-day price action over a set period, giving you a single, clean line on your chart. This makes the underlying trend much easier to spot.
I tell every new trader to think of the 200-day moving average as the market's true north. When a stock is consistently trading above this line, it’s a powerful sign that the long-term trend is up. If it's trading below, the bears are likely in control for the long haul.
You'll also hear about the golden cross. This is when a shorter-term moving average (like the 50-day) crosses above a longer-term one (like the 200-day). It's a classic bullish signal that often suggests a new uptrend is kicking off, giving you a potential heads-up to start looking for buying opportunities.
Relative Strength Index: Gauging Momentum
Moving averages are great for showing you the direction, but the Relative Strength Index (RSI) tells you how much gas is in the tank. It’s a momentum indicator that measures the speed and intensity of price changes on a simple 0 to 100 scale.
The textbook will tell you that a reading above 70 is "overbought" and one below 30 is "oversold." But here’s a pro-tip:
In a very strong uptrend, it's common for the RSI to stay in "overbought" territory for a long time. Instead of signaling a reversal is imminent, this actually confirms just how powerful the bullish momentum really is.
Volume: Confirming the Conviction
Volume might be the most overlooked indicator on the chart, but it's arguably the most important. It’s the raw number of shares being traded, and it essentially acts as the fuel behind any price move. A trend that's backed by high volume has real conviction. One without it is questionable.
Here's how to use volume to confirm what you're seeing:
- Uptrend Confirmation: In a healthy uptrend, you want to see volume pick up as prices rise and then dry up as prices pull back. This shows that buyers are enthusiastic on the way up.
- Breakout Validation: A breakout above a major resistance level is interesting, but a breakout on a massive volume spike is a game-changer. It tells you that a significant portion of the market is throwing its weight behind the new, higher price.
When you learn to combine moving averages for the trend, RSI for momentum, and volume for conviction, you create a much more robust framework for your analysis. These tools are the building blocks, and if you want to get even more comfortable with them, our guide on how to read stock charts for beginners is a great next step.
Reading Market Direction Across Different Timeframes
Here’s a secret that trips up so many new traders: the market’s direction isn't one single thing. It’s all about perspective. A stock can be in a monster, multi-year uptrend on its monthly chart, yet at the exact same time, be getting hammered in a multi-week pullback on its daily chart.
Think of it like standing on a beach watching the ocean. You have the massive, underlying tide slowly moving in or out—that’s your primary, long-term trend. Riding on that tide are big waves, which are the intermediate trends. And on the surface of those waves, you see all the little ripples and chop. Those are the short-term, day-to-day fluctuations.
As a swing trader, your job is to ride the waves (the intermediate trends) but always, always respect the direction of the main tide (the long-term trend). Trying to ride a tiny ripple against a powerful wave is a fast way to get swamped.
This is precisely why multi-timeframe analysis isn’t just some fancy technique for the pros; it's a fundamental survival skill. It keeps you from making that classic mistake of jumping into what looks like a hot new uptrend on a 15-minute chart, only to realize you just bought the exact top of a major downtrend on the daily chart.
The Telescope, Magnifying Glass, and Microscope
To make consistently better trading decisions, you have to learn to look at the same stock through different lenses. This layered approach ensures you don't get caught on the wrong side of a big move and helps you nail your entry points with far greater precision.
Here's a simple, powerful way to think about it:
Long-Term (The Telescope): First, zoom way out. Use a weekly or even a monthly chart to get the big picture. Is the primary tide coming in or going out? A stock trading cleanly above its 40-week moving average, for example, is in what we'd call a confirmed long-term uptrend. This is your foundation.
Mid-Term (The Magnifying Glass): Next, zoom into the daily chart. This is your main workspace as a swing trader. Here, you're looking for those "waves"—the tradable swings and channels that form within the larger primary trend. This is where you hunt for opportunities, like buying dips in a confirmed uptrend or shorting rallies in a downtrend.
Short-Term (The Microscope): Finally, use an hourly or 4-hour chart to get granular. This is all about timing. This tighter view helps you pinpoint the exact moment a stock bounces off support inside a daily channel, giving you a chance to get in with a very clear, low-risk entry.
When you get the market direction to agree across these three timeframes, you create a powerful alignment for your trade. You’re no longer just taking a guess; you’re placing a bet that has the wind at its back on multiple levels. This layered analysis is a hallmark of disciplined, consistently profitable trading.
Confirming the Trend with Price Action and Channels
Indicators are great for giving us clues, but when it comes to confirming the direction of the market, nothing beats pure price action. This is where we stop looking at abstract data and start reading what the market is actually doing. It all comes back to the classic Dow Theory: an uptrend is simply a series of higher highs and higher lows, while a downtrend is a series of lower highs and lower lows.
When you see these patterns repeating, they carve out predictable price channels on the chart. Think of a stock in an uptrend like a ball bouncing up a staircase. Each time it hits a step (support), it bounces to a new, higher level (resistance). If you draw a line connecting the lows (the steps) and another connecting the highs (the peak of each bounce), you get a perfect ascending channel.
This visual roadmap is the bread and butter of a successful channel trader. It removes the guesswork and gives you a clear, repeatable framework for knowing when to make your move and, just as importantly, when to sit on your hands.
Visualizing the Trend with Price Channels
So, what is a price channel? It’s simply two parallel trendlines that contain a stock's movement. The lower line acts as support, a floor where buyers typically step in and push the price up. The upper line is resistance, a ceiling where sellers tend to take control and push the price back down.
Spotting a stock moving neatly inside one of these channels is like being handed a cheat sheet for its next move.
- Ascending Channel (Uptrend): The game plan is straightforward—look for buying opportunities when the price pulls back to the lower support trendline. Your initial target becomes the upper resistance trendline.
- Descending Channel (Downtrend): Here, you flip the script. You’re looking to sell or short the stock as it rallies to the upper resistance trendline, with a price target near the lower support line.
- Horizontal Channel (Sideways): This is all about trading a range. You buy near the bottom support level and sell at the top resistance level. Our guide on rolling stock prices digs much deeper into this specific strategy.
This flowchart illustrates how to layer your analysis. You start with the big picture and then zoom in, ensuring your trades are always aligned with the dominant market forces.
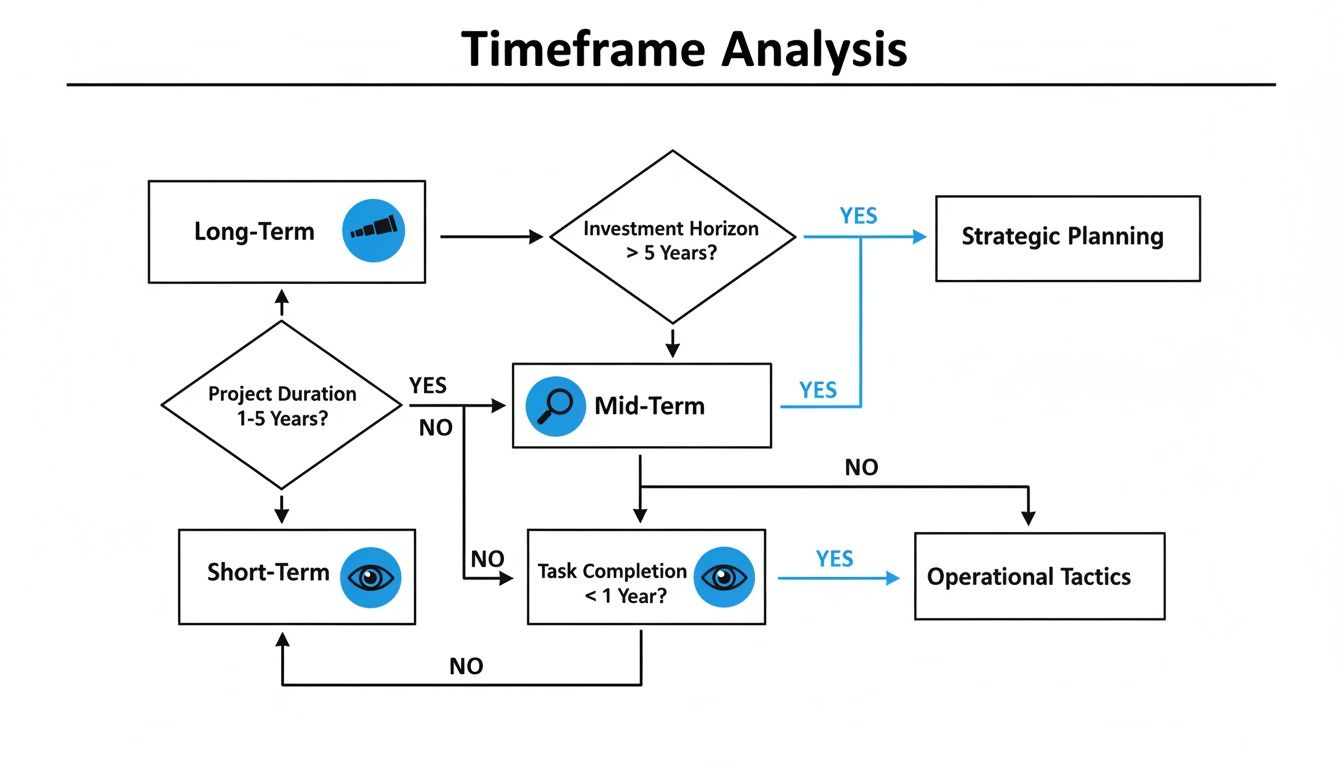
Think of it as using a telescope for the long-term trend before switching to a microscope for your precise entry. This approach keeps you trading with the current, not against it.
Channels in a Broader Economic Context
You might think this all breaks down in a choppy or slowing economy, but these channeling principles often become even more reliable. For instance, the UNCTAD global growth report forecasts that global GDP expansion will cool to 2.6% through 2026, with U.S. growth slowing to just 1.5%.
An environment like this often traps major indices in well-defined trading ranges. We saw a perfect example recently when the US500 had a 5.46% monthly drop, all while remaining within its broader 14.23% yearly uptrend. Those pullbacks are gold for channel traders. In these conditions, we can use our watchlists to find stocks bouncing between clear support and resistance, turning what feels like a macroeconomic headache into a series of repeatable, high-probability trades.
The key takeaway is that price channels provide a clear roadmap. They define your entry points (near support), your exit points (near resistance), and your stop-loss placement (just below a confirmed support level). This structure instills discipline and removes emotion from the trading process.
Actionable Rules for Trading with the Market Trend
Knowing the market’s direction is a great first step, but actually trading it profitably? That takes a non-negotiable set of rules. Let's be honest: trading without a plan is just expensive gambling. This framework is all about building discipline. It’s designed to help you align every move you make with the primary direction of the market and protect your capital on every single trade.
Think of it this way: if the market is a powerful river flowing north, you don't fight it by trying to paddle south. You look for the fastest currents and ride them.
Rule 1: Don't Fight the Trend
We’ve all heard the old saying, "the trend is your friend." It's repeated so often because it’s the absolute cornerstone of profitable trading. Trying to fight a confirmed trend is a low-probability game that will drain your account and your confidence faster than anything else.
So, instead of trying to be a hero by picking the exact top or bottom, your job is to find a safe way to join the party. If a stock is in a clear uptrend, you should only be thinking about buying. If it’s in a strong downtrend, your entire focus should be on opportunities to sell. This simple mental shift dramatically stacks the odds in your favor.
Rule 2: Buy the Dips, Not the Rips (and Vice-Versa)
Once you've identified the trend, your entry strategy becomes much clearer. In a confirmed uptrend, you resist the temptation to chase prices as they're screaming to new highs. That’s buying out of FOMO. Instead, you wait patiently for the price to pull back—or "dip"—toward a support level, like the bottom of its channel. This is where you find your lower-risk entry.
For instance, when a stock is climbing within an ascending channel, every time it touches the lower trendline, it presents a potential buying opportunity. This is where a solid understanding of support and resistance is critical. If you want to go deeper on this, check out our complete support and resistance trading strategy guide.
In a downtrend, you do the exact opposite. You look to sell or short the "rips"—those brief, sucker-rally bounces back up to a resistance trendline—right before the next leg down begins.
Key Takeaway: The highest-probability trades happen when you buy weakness inside a bigger uptrend or sell strength inside a bigger downtrend. This approach keeps you perfectly in sync with the dominant market forces.
Rule 3: Always Know Your 'Out' Before You Get In
Let me be clear: no matter how perfect a setup looks, any trade can fail. That’s just a fact of trading. This is why every single entry must have a predefined exit plan, specifically a stop-loss order. Your stop-loss is your emergency brake; it’s what keeps a small, manageable loss from turning into a catastrophic one.
Here’s a simple way to set your stop-loss when you're trading with the trend:
- In an Uptrend: Place your stop-loss just below the key support level or trendline you used for your entry. For us channel traders, that’s usually right below the lower channel line.
- In a Downtrend: Place your stop-loss just above the key resistance level that triggered your short entry.
By making these rules your own, you build a structured, repeatable process for working with the market, not against it. This is the discipline that separates the consistently profitable traders from the rest of the crowd.
Common Mistakes When Reading Market Direction
Figuring out which way the market is headed is a skill, and every trader pays some "tuition" to the market while learning it. The smart move is to learn from the mistakes of others—it's a whole lot cheaper. Let's walk through the common stumbles so you can learn to avoid them.
One of the biggest hurdles is analysis paralysis. This is what happens when your chart looks like a bowl of spaghetti because you've thrown every indicator at it—multiple moving averages, RSI, MACD, Bollinger Bands, you name it. Instead of clarity, you get a mess of conflicting signals that leaves you frozen, unable to pull the trigger.
Then there’s the classic trap of confirmation bias. This is our brain's sneaky habit of only looking for evidence that confirms what we already believe. If you're convinced a stock is going up, you might latch onto one tiny bullish signal while completely ignoring the roaring bearish trend staring you in the face.
Ignoring Crucial Context
Many traders get so locked into price wiggles that they forget to look at the context that actually gives those wiggles meaning. This is a fast track to getting into trades based on flimsy, misleading signals.
Two critical pieces of the puzzle often get missed:
- Ignoring Volume: You spot a stock punching through a key resistance level and you jump aboard, only to see it fizzle out and reverse course almost immediately. What happened? That breakout likely happened on pathetic, unconvincing volume. It shows there was no real conviction or big money behind the move. A real, sustainable move is almost always backed by a surge in volume.
- Timeframe Disconnect: A trader finds a perfect-looking uptrend on the 15-minute chart and confidently goes long. What they missed was the daily chart, which shows the stock is in a monster downtrend and has just slammed into a major resistance level. This is how you end up fighting a tidal wave with a pool noodle—the smaller trend gets crushed by the larger one.
The fix for these mistakes is all about simplification and discipline. Pick a couple of core indicators you truly understand, and use them to confirm what price is already telling you, not to predict the future. And always, always check your signals against volume and look at the bigger picture on multiple timeframes before you risk your capital.
By knowing what these common errors look like, you can build a much more objective and durable trading process. It's not about being right 100% of the time. It’s about sidestepping the unforced errors that can bleed an account dry. Your disciplined process is the best defense you have against these predictable traps.
Frequently Asked Questions About Market Direction
As you get deeper into chart analysis, you'll naturally bump into some recurring questions about market direction. Getting these concepts straight is one of the biggest steps you can take toward building a solid trading foundation. Let’s walk through some of the most common ones.
How Do News Events Affect the Direction of the Market?
Think of a big news event—like an earnings surprise or a Fed announcement—as a speed boat zipping down a river. It’s going to kick up a lot of wake and chop on the surface, causing a ton of short-term volatility.
But that choppy water is just noise. It rarely changes the actual direction the river is flowing. A disciplined trader learns to see past the scary headlines and the one-day panic selling. More often than not, once the initial shock wears off, the stock will settle back into its primary trend. Don’t get shaken out of a perfectly good trade just because of some temporary disruption.
What Is the Best Timeframe for Determining Market Direction?
There’s no magic answer here—the right timeframe is the one that matches your trading plan. The biggest mistake you can make is trying to be a swing trader while staring at a 1-minute chart. It just doesn't line up.
You have to sync your analysis with how long you plan to be in a trade.
- Day Traders: Live on the shorter-term charts. The 5-minute and 15-minute are their bread and butter for catching moves that happen within a single day.
- Swing Traders: The daily chart is home base. This is where you'll spot trends that last for days or weeks, though you'll always want to glance at the weekly chart to make sure you're not swimming against a bigger tide.
- Position Traders: Think bigger picture. The weekly and monthly charts are essential for guiding trades you might hold for several months, or even years.
The core principle is simple: your decisions should be based on the timeframe you're trading. A swing trader shouldn't panic over an intraday dip on a 5-minute chart if the daily trend is still perfectly intact.
Can a Stock Go Up if the Overall Market Is Down?
Absolutely. In fact, finding these gems is what separates the pros from the crowd. When the S&P 500 is bleeding red but one of your stocks is holding steady or even inching higher, you've found something special. It's showing what we call relative strength.
This is a huge tell. It means buyers are so interested in this specific stock that they’re willing to buy it even when everything else is being sold off. These stocks are effectively defying gravity. Keep a close eye on them, because they are often the first to launch into new highs when the broader market finally finds its footing. Their ability to stand strong in a weak market signals serious underlying demand.
At Channeling Stocks, we do the heavy lifting for you. Our team curates weekly lists of stocks trading in clean, predictable channels, helping you spot these kinds of high-conviction opportunities without the guesswork. See how our service can bring more clarity to your trading at https://www.channelingstocks.com.