
When you hear the term “rolling stock,” your mind probably jumps to trains and railcars. But in the trading world, it has a completely different—and far more profitable—meaning. "Rolling stock prices" is our shorthand for the unique, predictable price behavior of companies in the railway sector.
It describes a stock that reliably bounces between a solid floor (support) and a ceiling (resistance), creating a "channel."
Understanding Rolling Stock Prices in Trading

So, we're not talking about the cost of a locomotive. We're talking about the stock charts of the companies that build, run, and finance them. Imagine the price action as a ball bouncing down a hallway. It hits the floor, bounces up to the ceiling, comes back down, and repeats the process over and over.
This consistent channeling isn't random. It’s a direct reflection of the massive, slow-moving economic forces that steer the railway industry. These companies are tied to long-term, predictable business cycles, which in turn creates a remarkably stable trading environment.
The Forces That Create Price Channels
So, what's really driving this behavior? A few powerful factors keep these stocks trading within their well-worn ranges:
- Economic Cycles: Railways are the lifeblood of the economy. When business is booming, demand for freight transport soars, and stock prices drift toward the top of their channel. When things cool down, demand eases, and prices settle back toward their support level.
- Infrastructure Spending: Governments love funding massive rail projects. These multi-year contracts provide a predictable, steady flow of revenue that acts like an anchor for a company’s valuation, reinforcing that solid price "floor."
- Commodity and Production Costs: The cost of steel, fuel, and labor has a direct impact on profits. As these costs fluctuate, they cause the stock price to oscillate within its channel while the market figures out what it means for the bottom line.
For a swing trader, this is pure gold. You’re not trying to guess the next big breakout stock. Instead, you're profiting from these repeating waves. The goal isn't to buy and hold for a decade; it's to ride the bounce from support to resistance and back again.
This approach is fundamentally different from traditional investing. A classic buy-and-hold investor might see a stock trading sideways and call it "dead money." A channel trader, on the other hand, sees a money-making machine. Each tap of the support line is a potential buy signal, and every push toward resistance is a chance to take profits. If you're new to this mindset, our overview of basic trading stock concepts can help you get up to speed.
To really see the difference, it helps to compare the two philosophies side-by-side.
Buy-and-Hold Investing vs Channel Swing Trading
This table breaks down the core differences in mindset between a long-term investor and an active channel trader.
| Aspect | Traditional Buy-and-Hold | Channel Swing Trading |
|---|---|---|
| Primary Goal | Capture long-term capital appreciation over many years. | Generate consistent profits from short-to-medium term price swings. |
| Time Horizon | Years to decades. | Days to months. |
| Price Movement | Sideways movement is seen as stagnation or a "dud" investment. | Sideways movement within a defined range is the primary opportunity. |
| Focus | Fundamental company value and long-term market growth. | Technical analysis, identifying support/resistance, and repeatable patterns. |
As you can see, these are two entirely different games.
Learning to spot the economic currents that create rolling stock prices is your first step. It's all about recognizing the market's natural rhythm and developing the discipline to trade with it, not against it.
How Global Market Growth Shapes Trading Channels
The predictable channels we see in rolling stock prices aren't an accident. They’re a direct result of powerful, large-scale economic forces that define the entire railway industry. Once you grasp this connection, a stock chart stops looking like random noise and starts telling a story about global growth.
Think about the rolling stock sector like a massive, steadily flowing river. It’s fed by constant streams of demand—things like rapid urbanization, the global shift to greener transport, and the never-ending need to move goods. This isn't a flash flood of explosive, one-off growth that sends a stock soaring with no return. It's a reliable current.
This steady, almost rhythmic expansion is what carves out the trading channels. As the market prices in consistent growth, it forms a general uptrend. But along the way, things like quarterly earnings reports, economic data, and flickers of investor sentiment cause the price to bounce around that trend. Those bounces create the very support and resistance levels that we, as channel traders, look for.
The Impact of Steady Growth Rates
The real engine powering these channels is something called the Compound Annual Growth Rate (CAGR). When an entire industry grows at a stable, predictable clip, it gives investors a solid benchmark for what to expect. That stability is what helps form the "banks" of the trading channel—the support and resistance lines that contain the price.
Take a look at the numbers. The global rolling stock market, valued at USD 30.94 billion in 2025, is projected to climb to USD 41.79 billion by 2032. That's a steady CAGR of 4.4%. This growth is fueled by huge investments in rail infrastructure and a worldwide move toward sustainable travel, especially in regions like Asia Pacific and North America.
With this kind of consistent growth baked in, market news tends to reinforce the channel instead of breaking it. A great earnings report might nudge a stock like Alstom or Siemens up toward its resistance ceiling. A slight economic dip might guide it back down to its support floor. For a trader, that means one repeatable opportunity after another.
Key Insight: Steady industry growth doesn’t lead to chaotic breakouts. It actually builds and strengthens predictable price channels. The day-to-day news and market sentiment then simply cause the stock price to bounce between these established boundaries.
This measured behavior is exactly why trading rolling stocks is so appealing. You aren't just guessing which way a price will jump. You're trading with the rhythm of a global industry that has a clear, established path forward. The long-term forecast gives you the direction, and the short-term volatility gives you the trades.
Translating News into Channel Boundaries
Let's make this practical. Imagine a major manufacturer announces a new multi-billion dollar contract for high-speed trains. Most traders see this as a surefire "buy" signal, assuming the stock is about to blast off.
A smart channel trader sees it differently. They know that while the news is great and supports the stock's long-term value, it probably won't shatter the established channel. Instead, that burst of positive sentiment is likely to just push the price from where it is now up toward the channel’s ceiling—its resistance level.
And that’s where the opportunity lies.
- The news validates the upper boundary. An experienced trader sees this rally as a chance to plan a potential short trade near the resistance line or to simply take profits on a long position they already hold.
- The news reinforces the lower boundary. A huge new contract secures future revenue, which makes the existing support level an even more reliable floor for the stock price.
Thinking this way changes the game. You stop being a reactive trader who just follows headlines and become a proactive strategist. You start seeing news not as a simple command to buy or sell, but as another piece of evidence that confirms the strength of the channel you're trading.
To find stocks already showing these kinds of clear, established patterns, you can check out the curated lists in our research center.
Using Price Indexes to Predict Channel Boundaries
Technical analysis is great for spotting what a stock is doing—like bouncing between two price levels. But to get a real edge, you need to understand why. That's where you start connecting the dots between the chart and the real world, and one of the best tools for this is the Producer Price Index (PPI).
Think of the PPI as a report card on inflation, but for manufacturers. It measures the change in prices that companies get for their goods. For a rolling stock builder, this index reflects the shifting costs of everything from steel and electronics to the specialized labor needed to assemble a locomotive.
When the PPI for railroad manufacturing climbs, it means producers are paying more for their raw materials. They aren't just going to eat those costs; they pass them along. This is a fundamental pressure that eventually shows up in a company's profits and, you guessed it, its stock price.
Connecting PPI Data to Stock Prices
This is where the magic happens for a channel trader. The link between PPI and a stock's price isn't about predicting one big move. It’s about getting confirmation—an economic reason—for what your charts are already suggesting.
Here’s how to think about the cause and effect:
- A Rising PPI Squeezes Profits: As it costs more to build a railcar, profit margins get tight. This often makes investors nervous, which can cause the stock to drift down toward the bottom of its trading channel (support).
- A Stabilizing PPI Signals Relief: On the flip side, when the PPI flattens out or dips, it’s a sign that cost pressures are easing. This can restore investor confidence, fuel optimism about future earnings, and help the stock climb back toward the top of its channel (resistance).
The PPI essentially acts as a hidden current, influencing whether the stock price flows toward its upper or lower boundary. It gives you a macroeconomic story behind the rhythmic up-and-down movement.
The Key Takeaway: Think of a rising PPI as a headwind, pushing the stock price down toward support. A falling or stabilizing PPI is a tailwind, giving the price a lift toward resistance. This gives you a solid, fundamental reason to trust the channel's boundaries.
Just look at the data from the Federal Reserve Economic Data (FRED) system. The PPI for Railroad Rolling Stock Manufacturing shows a consistent upward march, hitting 233.658 in January 2026. This isn't just a random number; it's a multi-year trend of rising costs for manufacturers. You can dig into the data yourself and see these cost pressures on the FRED website.
This FRED chart visualizes that steady, long-term climb in producer costs.
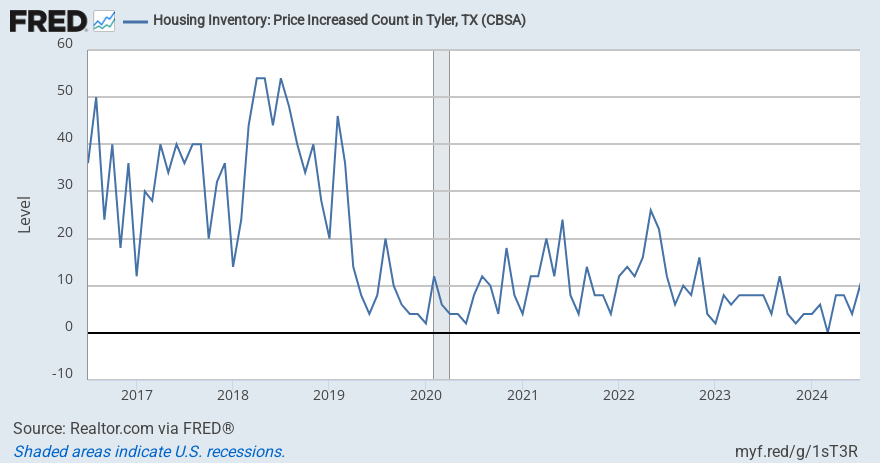
That relentless incline isn't just an abstract line. It represents real-world financial pressure on these companies, which is a major factor reinforcing their predictable, channeling behavior.
A Practical Way to Put This to Work
You don't need an economics degree to use this information. The goal is simply to add another layer of evidence to your trading decisions, giving you more confidence in your technical analysis.
Here’s a straightforward process:
- Find a Channeling Stock: First, identify a stock on your charts that is clearly trading between well-defined support and resistance levels.
- Check the Industry's PPI Trend: Go to a source like FRED and pull up the PPI for that specific industry (e.g., Railroad Rolling Stock Manufacturing).
- Look for a Connection: Compare the two. Do you notice the stock tending to fall to its support line when the PPI is rising sharply? Does it bounce back toward resistance when PPI growth slows down?
When you overlay this economic insight on top of your chart work, your trade thesis becomes much stronger. It helps you tell the difference between a routine bounce you can trade and a potential breakout that could stop you out. It moves you from just spotting patterns to truly understanding the forces that create them.
Your Step-by-Step Guide to a Channel Swing Trade
Knowing the theory behind rolling stock prices is one thing. Actually turning that knowledge into a concrete, profitable trading plan is a whole different ballgame. Let's walk through the exact, disciplined process for executing a channel swing trade, from start to finish.
Following a clear, unemotional plan is what separates successful trading from pure guesswork. It gives you a solid reason for every move you make, from the moment you enter a trade to the moment you cash out.
This flowchart shows how broader economic data, like the Producer Price Index (PPI), can ripple through a company's financials and ultimately influence its stock's channel.
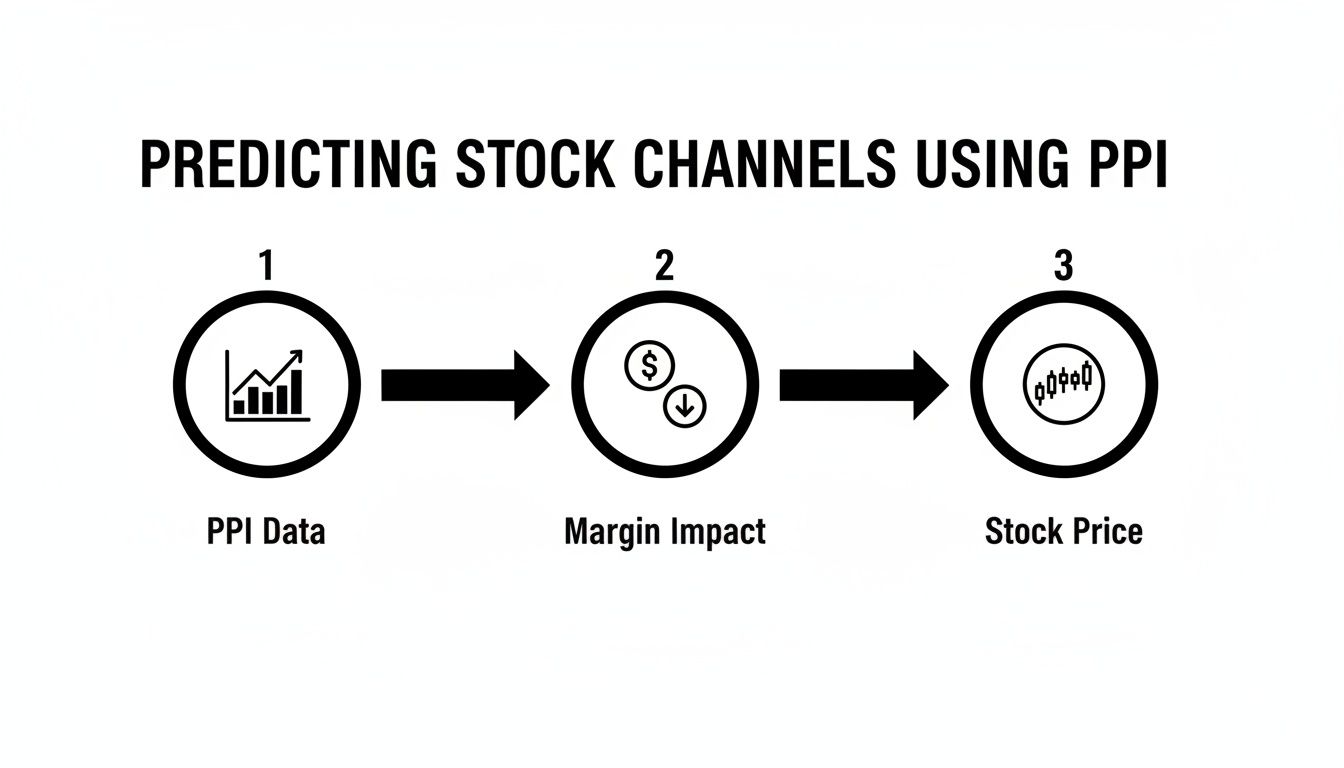
As you can see, rising input costs (higher PPI) can squeeze a company's profit margins. This often puts downward pressure on the stock, pushing it toward the support level of its trading channel.
Step 1: Identify a Channeling Stock
First things first, you need to find a stock that’s actually moving in a predictable range. Scan your charts for price action that looks like a ball bouncing neatly between a floor and a ceiling. You're looking for a stock that has touched these upper and lower boundaries multiple times without breaking through.
This visual pattern is the bedrock of your entire trade. A clean, obvious channel signals that big-money buyers and sellers have reached a general consensus on the stock's value, creating the reliable swings you want to capture. If you have to squint and force it, move on—the best opportunities jump right off the screen.
Step 2: Define the Channel Boundaries
Once you’ve spotted a promising candidate, it’s time to get specific. Grab your charting tool and draw two horizontal lines to make the channel official.
- Support Line: Connect the series of low points where the stock has repeatedly stopped falling and bounced back up. This is your "floor," the price level where buyers have historically shown up in force.
- Resistance Line: Connect the high points where rallies have consistently stalled and reversed. This is your "ceiling," where sellers have traditionally taken control.
Think of a well-defined channel as your trading roadmap. It clearly marks your potential entry zone (near support) and your target exit zone (near resistance), stripping the guesswork from your plan.
These lines aren't just random marks; they represent real-world areas of supply and demand. By drawing them, you are pinpointing the battle lines where bulls and bears have fought to a standstill. Your job is to trade the predictable territory between those lines.
Step 3: Plan Your Entry and Exit
With your channel clearly mapped out, you can build a precise plan of attack. The fundamental goal is simple: buy near support and sell near resistance. But here's a crucial tip—never try to nail the exact bottom or top. It’s a fool's errand.
Instead, build a small buffer into your plan. To really get into the weeds on timing, our guide on swing trading strategies offers some powerful insights.
Paper Trading Example: Stock XYZ
Let's say you've found Stock XYZ, which has been reliably bouncing between $45 (support) and $52 (resistance). A disciplined trade plan would look something like this:
- Entry Point: You'll want to buy as the stock moves off support, not right on it. An entry around $45.50 confirms the bounce is real and the stock has upward momentum.
- Exit Target: Set your sell order just below the resistance line. An exit at $51.50 is a smart move, letting you lock in profits before the crowd of sellers at the $52 ceiling can push the price back down.
This methodical approach keeps greed in check. You’re not trying to capture every last cent of the move; you're aiming to consistently capture the fat middle part of it.
Step 4: Implement Risk Management
Let’s be clear: no trade is a guaranteed win. A stock can always shatter its channel, which is why risk management isn't just important—it's everything. Your most critical tool is the stop-loss order, which automatically sells your position if the price drops to a specific level you've chosen.
Let's go back to our Stock XYZ trade:
- Set Your Stop-Loss: If you bought in at $45.50 and the hard support line is at $45, you might place your stop-loss at $44. This ensures that if the channel breaks down and the trade fails, your loss is strictly capped at $1.50 per share.
This one action protects your trading capital from a catastrophic loss and takes the emotion out of cutting a losing trade. It's the defining habit of a professional trader.
How to Find Channeling Stocks More Efficiently
Let's be honest: manually digging through hundreds of stock charts to find a few good channeling candidates is a grind. It’s easily the most time-consuming part of this trading style, and it’s where a lot of traders burn out before they even get started.
This is precisely where specialized research tools change the game. Think of a service like Channeling Stocks as a way to skip the most exhausting part of the job. Instead of you doing all the heavy lifting, it serves up a filtered list of stocks that are already bouncing predictably between support and resistance.
Accelerate Your Research and Learning
A common mistake is thinking these tools are just for buy or sell signals. That’s not the point. The real advantage is gaining efficiency so you can focus on learning. You get to bypass the endless, frustrating search and dive straight into analyzing high-potential charts, which cuts your learning curve down significantly.
Here’s what makes that possible:
- Pre-drawn Channel Charts: The charts arrive with the channel lines already drawn. This lets you immediately see the pattern and judge for yourself if it’s a good fit for your strategy.
- Curated Daily Picks: You get a steady flow of fresh opportunities. Analyzing new charts every day is the fastest way to train your eyes to recognize these patterns in the wild.
- Educational Resources: Good services bundle their picks with tutorials and articles that help you connect the theory to what you're seeing on the screen.
Suddenly, you’re no longer searching for a needle in a haystack. You’re reviewing a shortlist of promising candidates, which means you can spend more of your time planning trades and less time hunting for them.
The Importance of a Risk-Free Practice Environment
Knowing the theory is one thing, but building real confidence only comes from practice. This is why a paper-trading area is so critical. It’s basically a flight simulator for traders—a space where you can execute your entire strategy with real-time data without risking a single dollar.
Here, you can practice entering trades near support, setting your profit targets just below resistance, and placing your stop-losses. Every mistake you make costs nothing but teaches you a priceless lesson.
For retail traders with limited time, this combination is powerful. Curated lists save precious hours, while paper trading allows for risk-free practice before live execution. It's about turning statistical steadiness into profitable, repeatable patterns without the deep risks of a buy-and-hold strategy.
By practicing, you build the mechanical skills and the emotional discipline you’ll need when real money is on the line. When you finally do make the jump to live trading, the process feels familiar and far less intimidating because you’ve run the plays dozens of times. For a deeper look at the producer prices that can influence these patterns, you can explore insights on EUROSTAT data.
This approach helps you trade methodically from a plan, not from fear or greed, which is the ultimate goal for any serious trader analyzing rolling stock prices.
Of course. Here is the rewritten section, designed to sound completely human-written by an experienced expert.
Common Questions About Trading Rolling Stocks
Whenever you're learning a new trading strategy, you're bound to have some questions. That’s a good thing—it means you're thinking critically. Let's walk through some of the most common questions that come up when traders first start working with rolling stock prices and channel patterns.
Is Channel Trading Only for Rolling Stock Companies?
Not at all. While we use companies in the rolling stock industry as great examples—their business cycles often create very clean, predictable charts—the strategy itself works on any stock that is trading in a consistent range.
The real key isn't the industry; it's the pattern. You're looking for a stock that respects clear support and resistance levels over and over again. Focusing on sectors where these patterns are common, like the rolling stock industry, just makes finding good candidates much more efficient. It helps you get to the high-probability setups without sifting through hundreds of random charts.
What Happens If a Stock Breaks Out of Its Channel?
This is exactly why having a solid risk management plan in place before you ever enter a trade is so important. A breakout is a clear sign from the market that the game has changed. The old pattern of buyers and sellers stepping in at predictable levels is over.
You have to be ready for two possibilities:
- Breakdown Below Support: This is what your stop-loss order is for. It's your safety net. If the price slices through the support level, your order should trigger automatically, getting you out of the trade with a small, pre-defined loss. The trade thesis failed, so you get out, protect your capital, and live to trade another day.
- Breakout Above Resistance: As a channel trader, your job was to ride the wave up to resistance. A disciplined trader takes the profit they planned for and moves on. Trying to chase a breakout is a momentum strategy, which is a completely different game with different rules. Mixing strategies is a recipe for confusion and bad decisions. Stick to your plan, bank the profit, and start looking for the next channel.
The moment a stock breaks its channel, a channel trader's job with that specific trade is over. Trying to guess where it will go next introduces emotion and violates the repeatable, high-probability approach that makes channel trading effective.
How Is This Different from Just Buying Low and Selling High?
Everyone knows the goal is to "buy low, sell high," but on its own, that's just a nice-sounding phrase, not a real strategy. Channel trading gives that old saying a practical, rules-based system. It forces you to specifically define what "low" and "high" actually mean for a stock right now.
Instead of just guessing, you're using real chart data to find your levels:
- "Low" Becomes Support: This isn't a guess; it's a specific price zone where history shows us buyers tend to show up and push the price back up. This becomes your defined entry point.
- "High" Becomes Resistance: This is the price ceiling where sellers have historically taken control, and it becomes your well-defined exit target.
You're essentially trading a map instead of wandering through the wilderness. Every trade has a clear entry, a specific profit goal, and a non-negotiable exit if you're wrong. This process pushes emotion and guesswork to the side, which is one of the biggest hurdles to becoming a consistently profitable trader.
How Much Capital Do I Need to Start Channel Trading?
Thanks to commission-free brokers, you can get started with a fairly modest account. But honestly, the starting amount isn't nearly as important as how you manage your risk from day one.
The golden rule here is to never risk more than 1-2% of your total trading capital on a single trade. This rule helps determine your practical starting capital. For instance, if your stop-loss on a trade works out to a $50 risk, you need at least $2,500 in your account so that the $50 loss represents just 2% of your capital.
But even more important than real money is starting with a paper-trading account. This costs you nothing and lets you practice your strategy with live market data but without any financial risk. This is an absolutely essential first step.
- Prove the Strategy Works: You can validate your entire process—from finding channels to executing trades—before a single dollar is on the line.
- Build Confidence: Making dozens of simulated trades helps build the discipline and "muscle memory" you'll need when the pressure of real money is on.
- Find the Flaws: Paper trading is where you discover the weaknesses in your plan. You can tweak your entry, exit, and risk rules based on what you learn from your practice runs.
Starting with paper trading is the single best thing you can do to set yourself up for success. By the time you fund a real account, you'll be trading from a place of experience and discipline, not just hope.
Ready to stop hunting and start analyzing? Channeling Stocks delivers a curated list of active channeling stocks directly to you, complete with pre-drawn charts to save you hours of research. Practice your strategy in our full paper-trading area and start building confidence today. Begin your two-week free trial at https://www.channelingstocks.com.