
A flat top breakout is one of the most reliable bullish patterns you'll find on a chart. It’s a powerful setup where a stock pushes against a clear price ceiling again and again, coiling up energy before it finally bursts through. When you see this pattern, it’s a clear signal that buyers are wrestling control from sellers, often setting the stage for an explosive move higher.
The Anatomy of a Powerful Flat Top Breakout
Before you jump into a trade, you have to know what a high-quality setup looks like versus a dangerous fake-out. A true flat top breakout isn't just a random price squiggle; it tells a compelling story about the battle between supply and demand. Getting all the pieces right is what separates a high-probability trade from a costly mistake.
The whole thing starts with a prior uptrend. A breakout that appears from nowhere, without any preceding strength, is something I’m always wary of. That initial run-up is crucial because it shows there’s already a healthy appetite for the stock.
After that initial climb, the stock will begin to consolidate. This is where the real action is. Instead of pulling back hard, the price action tightens up and grinds sideways, repeatedly hammering against a very specific resistance price.
The Inviolable Resistance Line
The single most important feature of a flat top breakout is that clean, horizontal resistance level. This "top" forms as sellers consistently show up at the same price, preventing the stock from advancing. On a chart, it looks like a brick wall that the price just can't seem to get through.
But each time the price tests that level, something important happens. Think of it like trying to break down a door. The first few hits might not do much, but each subsequent impact weakens the frame. In the market, every test of resistance absorbs more supply from the sellers waiting at that price. Eventually, they run out of shares to sell, and the path of least resistance flips to the upside.
A key insight is that a breakout's strength is often proportional to the length of its consolidation. A base that forms over several weeks is typically more powerful than one that forms over a few days, as it suggests more significant accumulation by institutional players.
This well-defined resistance is non-negotiable. As covered in our guide to support and resistance trading strategies, these levels are major psychological battlegrounds. A breakout above such a clear line in the sand is a decisive signal that market sentiment has shifted firmly in favor of the bulls.
Volume Is the Ultimate Confirmation
While price action tells you what is happening, volume tells you why. A textbook flat top breakout needs to have a very specific volume signature to be trusted.
Dwindling Volume: As the stock consolidates under resistance, you want to see trading volume decline. We call this "volume drying up," and it's a great sign that sellers are losing interest and conviction.
Massive Breakout Volume: The moment the price punches through that flat top, volume must explode. This surge is your confirmation that big-money buyers are aggressively driving the move, not just that sellers have disappeared.
To help you spot these setups in real-time, here’s a quick-reference table outlining the key components. Use it as a checklist to grade the quality of any flat top breakout you're considering.
Key Characteristics of a High-Probability Flat Top Breakout
| Component | What to Look For | Why It Matters |
|---|---|---|
| Prior Trend | A clear uptrend leading into the pattern. | Shows existing demand and bullish momentum. |
| Horizontal Resistance | A well-defined, flat price ceiling tested at least 2-3 times. | Creates a clear breakout level and proves sellers are being absorbed. |
| Higher Lows | Ascending lows that push up against the flat resistance. | Indicates buyers are becoming more aggressive and paying higher prices. |
| Volume Contraction | Volume should decrease significantly during the consolidation phase. | Signals that selling pressure is fading away. |
| Breakout Volume Surge | A massive increase in volume on the breakout day. | Confirms institutional buying and the validity of the move. |
Think of these five components as the essential ingredients. If one is missing, especially the volume surge on the breakout, the odds of a failed pattern increase dramatically.
This concept isn't new; it has deep roots in classic technical analysis. The flat top breakout is a close cousin to the "flat base" pattern William O'Neil championed in his CANSLIM methodology, a go-to for growth traders since the 1980s. A core tenet is that legitimate breakouts require a huge surge in trading volume—at a bare minimum, 40-50% above average—to prove institutional sponsorship. Some of the best traders I know, like those at platforms such as TraderLion, won't even touch a breakout unless volume is at least 1.4 times its relative average, as it dramatically improves the odds of a sustained run.
How to Find and Qualify Breakout Candidates
Spotting a potential flat-top breakout pattern is just the first step. The real skill—the one that separates consistently profitable traders from those chasing every pop—lies in knowing how to qualify that setup. Not all breakouts are created equal, and you need a tough, repeatable filtering process.
I’ve learned the hard way that breakouts don’t happen in a vacuum. The broader market context is everything. My first rule is simple: I don't even bother looking for long setups unless the overall market, like the S&P 500, is in a healthy uptrend. Fighting the market's current is a losing game.
With the market at our back, I zoom in on the stock itself. A powerful flat top breakout has to launch from a position of strength. I'm looking for a clean, prior uptrend of at least 20-30%. This initial run-up proves there's already real demand for the stock, providing the fuel needed for the next leg higher.
Building the Ideal Consolidation
Once the stock has made its initial move, it will pause and begin to consolidate. This phase is where you can truly judge the quality of a setup. For me, two things matter most here: how long it consolidates and how tight the price action gets.
The time a stock spends building its base often correlates directly with the power of the eventual breakout. A quick, two-day pause isn't enough time for serious accumulation to take place. You want to see the stock go sideways for a while, giving patient institutional buyers the chance to absorb all the sellers.
This simple three-stage process is what we're looking for.
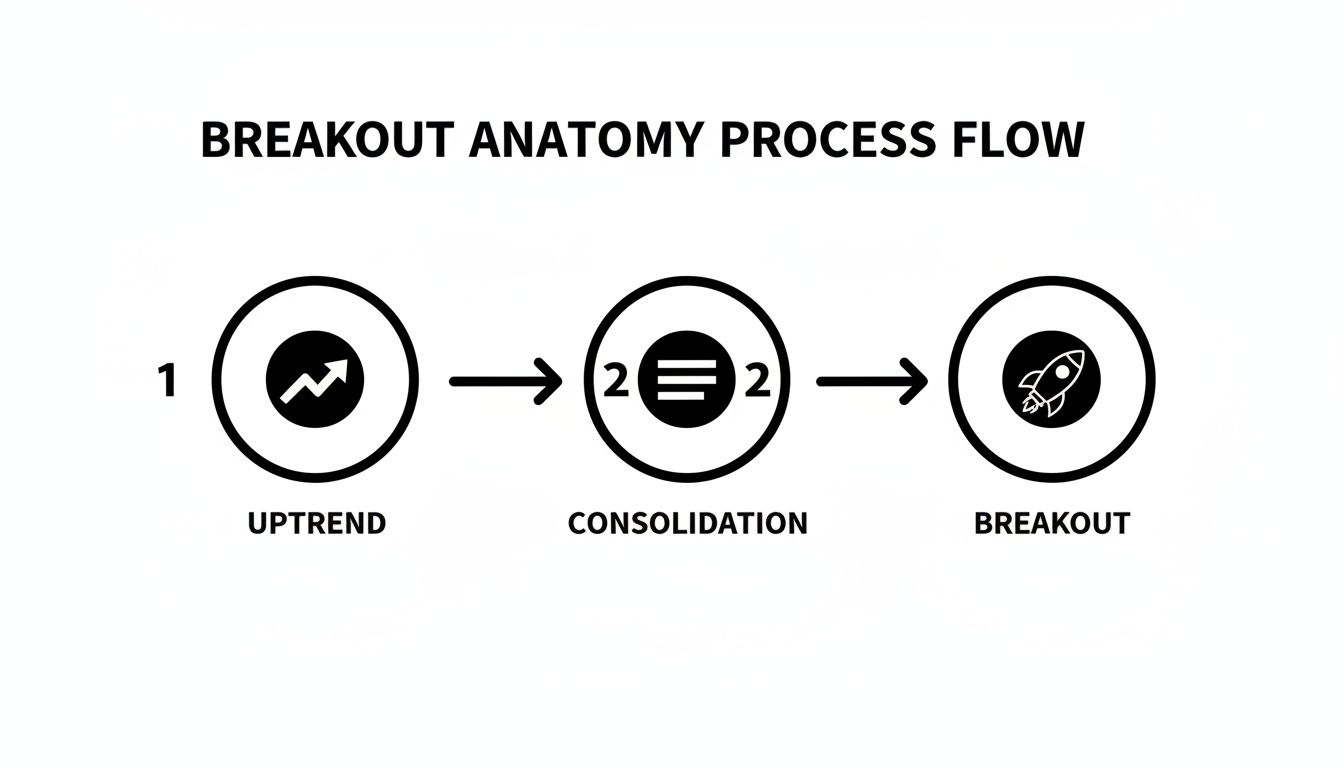
As the graphic shows, a strong prior uptrend creates the initial momentum. It's followed by a quiet consolidation that builds tension, setting the stage for that final, explosive move.
Looking at market data, the sweet spot for a flat base consolidation seems to be between 5 and 8 weeks. Bases that form in less than five weeks are often premature; they tend to fail about 70% of the time because not enough accumulation has occurred. On the other hand, setups that build over 6-8 weeks often show clear signs of institutional buying, leading to breakouts with 40-50% volume spikes and follow-through that can push prices 25-40% higher.
Reading the Story of Volume and Volatility
As the base forms, you have to become a detective, paying close attention to price and volume. Ideally, the price action should get tighter and tighter. I look for a consolidation range—measured from the high to the low of the base—that is under 15%. A tight range like this signals that the fight between buyers and sellers is reaching a stalemate. It’s a sign of equilibrium just before a big, decisive move.
Key Takeaway: Tight price action is a classic footprint of institutional accumulation. When the big money is quietly buying shares, they try not to push the price around, which results in lower volatility and a very orderly pattern.
Volume tells an equally important story. In a top-tier setup, you need to see the right volume signature.
- Declining Average Volume: As the stock drifts sideways below its resistance level, the average daily volume should noticeably drop off.
- Volume "Drying Up": I get really interested when I see specific days or weeks where volume is extremely low, often 40-50% below its recent average.
- No Big Selling Spikes: Watch out for any high-volume down days during the consolidation. That can be a red flag that institutions are quietly selling (distributing) their shares, not buying.
This "drying up" of volume is one of the most reliable tells I know. It signals that the sellers are gone; there's simply no supply left. When that selling pressure evaporates, it takes very little buying to push the stock through resistance, leading to the efficient and powerful breakout we're looking for. This dynamic is closely related to the concepts involved in analyzing rolling stock prices, where understanding these cycles of supply and demand is fundamental.
Pulling the Trigger: How to Enter the Trade
Seeing a clean flat top breakout pattern form on your chart is exciting. But identifying the setup is one thing; knowing the precise moment to put your money on the line is a completely different skill. This is where analysis meets action, and where a clear plan separates consistent profits from missed opportunities.

The most straightforward and reliable entry is triggered by a decisive price close above the resistance line. I'm not talking about a quick, fleeting pop above the level during the day. You want to see the candle—whether it's a 5-minute, hourly, or daily—finish its session firmly above that ceiling. This is your confirmation that buyers have seized control, not just startled a few sellers.
Volume: The Ultimate Confirmation Signal
A price breakout without a surge in volume is suspicious. It's just noise. For a flat top breakout to have real conviction, you absolutely need to see a massive spike in trading activity as the price pushes through resistance.
What I’m looking for is volume that jumps at least 40-50% above its 50-day average. This is a non-negotiable part of the pattern for me. It’s the clearest signal that big institutions are piling in, providing the fuel needed to sustain the move higher. A breakout on weak, anemic volume is a huge red flag—it’s often the signature of a bull trap that’s about to snap back into the base.
Think of it like this: price tells you what happened, but volume tells you how much conviction was behind it.
Reading the Story of the Breakout Candle
The specific candlestick that punches through resistance can tell you a lot about the move's hidden strength. Not all green candles are created equal.
- The Power Play (Long Green Marubozu): This is the A+ signal. A Marubozu is a long green candle with almost no wicks, meaning the stock opened near its low and closed at its high. It’s a sign of pure, unadulterated buying pressure all session long.
- The Solid Win (Strong Candle, Small Upper Wick): This is also a fantastic sign. It shows that while sellers tried to push back a little, buyers easily absorbed the pressure and still secured a powerful close.
- The Warning Shot (Candle with a Long Upper Wick): Be very careful with this one. A long "topping tail" indicates buyers tried to run the price up but were slammed back down by sellers. This is often a sign of exhaustion and a potential failed breakout.
Over the years, I've learned to obsess over where the breakout candle closes. A weak close near the middle of the candle, even if it’s above resistance, makes me nervous; it suggests the initial buying burst is already fizzling out. A strong close near the high gives me confidence that there’s enough momentum to carry into the next day.
Getting In Early: More Aggressive Entry Tactics
While waiting for a confirmed close is the safest route, some traders prefer more aggressive entries to get a better price. One common technique is the "cheat" entry, sometimes called a pivot point entry.
This involves buying before the actual breakout, as the price turns up from a low within the base and starts heading back toward the flat top. The goal is to anticipate the move. While this tactic is definitely higher-risk—the breakout isn't guaranteed—the reward is a lower cost basis and a bigger potential gain if you're right. It's an advanced method that really relies on having a good feel for price action.
This anticipatory approach isn't unique to flat tops. In fact, the final stage of a flat top breakout often mirrors the "handle" formation of another powerful bullish setup. You can see the similarities in our guide on how to trade cup and handle patterns on our blog.
In the end, your entry trigger needs to align with your personal risk tolerance. The textbook signal—a confirmed close above resistance on high volume—is the standard for a reason. It gives you the highest probability of a successful trade. A breakout without volume is a gamble, and we're here to trade a plan, not to roll the dice.
Smart Trade Management After the Breakout

You nailed the entry, the volume spiked just like you wanted, and now you're in the trade. This is where the real money is made or lost. Spotting a clean flat-top breakout is one thing, but how you manage the position from here is what separates a one-hit wonder from a consistently profitable trader.
Without a solid game plan for protecting your capital and taking profits, you're essentially just gambling. Let's walk through a practical framework for managing the trade from the second you’re filled to the moment you close it out.
Setting Your Stop-Loss to Protect Your Capital
First thing's first: risk management. Your stop-loss is your line in the sand. It's the point where you admit the trade isn't working and live to fight another day. Even the most perfect-looking setups can fail, so you absolutely must know your exit point before you enter.
There are a couple of logical spots to place your stop, each with its own pros and cons.
- A Tight Stop: You can place your stop just underneath the low of the breakout candle. This is an aggressive move that keeps your potential loss tiny if the stock immediately turns against you. The risk? You can easily get shaken out by a little noise before the real move happens.
- A Wider Stop: A more conservative approach is to set the stop below a key support level inside the base, like the midpoint of the entire consolidation. This gives the trade much more room to breathe, but it also means you have to take a smaller position size to keep your risk in check.
This is where position sizing becomes critical. If you have a $5,000 account and stick to a strict 1% risk per trade ($50), a tight stop means you can buy more shares. A wider stop forces you to buy fewer. This simple math is the foundation of professional trading.
Knowing Where to Take Your Profits
Just as you need a plan for being wrong, you need one for being right. "Let your winners run" sounds great, but it’s incomplete advice. Run where? If you don't have predetermined targets, you risk watching a great gain evaporate in a sudden reversal.
One of the most reliable techniques for setting a price target is called the measured move. The logic is simple: the size of the consolidation pattern often forecasts how far the stock will run after it breaks out.
To use this method, you first measure the height of the base from its lowest point to the flat resistance line. If a stock consolidated between $45 and $50, the base has a height of $5.
Then, you just add that height to the breakout point. Using our example, a breakout at $50 gives you a logical first target of $55.
This isn't just a random number; it's a data-driven target. It helps you take emotion out of the equation and gives you a clear spot to sell at least a portion of your position to lock in profits.
Riding the Trend with a Trailing Stop
Sometimes, a breakout just keeps going, blowing past your initial target. On these monster trades, you need a way to stay in for the ride without giving all your profits back. This is the perfect job for a trailing stop.
Instead of a fixed price, a trailing stop uses a technical indicator—usually a moving average—to tell you when the trend is bending. As the stock moves up, the moving average follows, locking in more of your gains automatically.
For most breakouts, a short-term exponential moving average (EMA) works best.
- The 8-day EMA: Use this for fast, aggressive movers. It’s a very tight trail, and you’d sell if the price closes below it.
- The 21-day EMA: This is my go-to for most swing trades. It’s wide enough to withstand normal pullbacks but still keeps you in the primary trend.
Using a moving average as your guide lets the market—not your fear or greed—tell you when the party's over. You only sell when the stock's price action proves the upward momentum is broken. This is how you capture the majority of a big move.
Navigating Failed Breakouts and Common Traps
Look, even the most picture-perfect setup can fall flat on its face. Trading is a game of probabilities, and taking losses is just part of the business. What isn't part of the business, though, are unforced errors. Learning to spot why a flat top breakout is failing is every bit as crucial as knowing what a successful one looks like. This is how you build the discipline to recognize a bad trade early and sidestep the most common traps.
One of the quickest ways to lose money is by chasing. You see a stock ignite, FOMO grips you, and you jump in well after the initial move. The problem? You're buying at a terrible price right when the smart money who bought at the base is starting to sell. They take their profits, the stock pulls back, and you're left holding the bag.
Another classic mistake is buying a breakout that has no gas in the tank. A push through a key resistance level without a significant surge in volume is a huge red flag. It tells you the big institutions aren't participating. Without their buying power, the move is often a flimsy head-fake, ready to reverse and trap eager buyers.
Recognizing the Early Warning Signs
The market almost always whispers clues before a breakout rolls over and fails. Your job is to learn the language so you can act decisively. A failed breakout happens fast, and hesitation is expensive.
A breakout on low volume is probably the most telling sign of trouble. As we've covered, volume is conviction. If the price inches past resistance but the volume bars look anemic, it's a signal of exhaustion, not enthusiasm.
Pay close attention to the breakout candle itself. A candle that pops through resistance only to close way off its highs—leaving a long upper shadow or "topping tail"—is screaming "rejection." It shows that buyers tried to push higher but were slammed back down by sellers. You're watching buyers lose the battle in real time.
A breakout that immediately falls back below the resistance level is a failed pattern. There's no gray area here. The moment it closes back inside the base, your original trade thesis is invalid, and your stop-loss should be triggered.
A truly strong stock rarely messes around. If a stock breaks out and then just drifts sideways for an extended period, it's often a sign that it lacks the power for a real follow-through. The longer it stalls, the more time you give sellers to regroup and take control.
The Power of a Fundamental Catalyst
Sometimes, the secret ingredient for a monster breakout isn't even on the chart. A powerful fundamental catalyst—a real-world event that changes a company's story overnight—can bring in a flood of new, motivated buyers.
Think about these kinds of game-changing events:
- A huge earnings beat: When a company smashes earnings and revenue estimates, Wall Street is forced to re-evaluate what the stock is worth.
- FDA approval: For any biotech, positive trial data or a new drug approval can be an explosive, stock-altering event.
- An unexpected contract win: Landing a massive new client or government contract can signal a dramatic shift in future revenue.
When you find a clean flat top breakout forming just before or right after one of these catalysts hits the news, you have an incredibly potent combination. The technical pattern shows the stock is coiled for a move, and the fundamental story provides the explosive fuel.
A strong catalyst almost guarantees you'll get the heavy institutional volume needed for a sustained trend. For example, if a stock has been building a tight base for six weeks and then announces record-breaking earnings, the breakout that follows is far more likely to have legs. Always check the news; it can be the difference between a small pop and a major new uptrend.
Your Top Questions About Flat Top Breakouts
Alright, you've got the theory down, but trading in the real world always throws up a few curveballs. It's one thing to see a pattern on a chart and another to put your hard-earned money on the line.
Let's walk through some of the most common questions and sticking points traders run into when they first start hunting for flat top breakouts.
What’s the Difference Between a Flat Top Breakout and an Ascending Triangle?
They look like cousins, don't they? The key difference is what's happening underneath that ceiling of resistance.
An ascending triangle is defined by a series of higher lows pushing up into the resistance line. You can draw a clean, upward-sloping trendline connecting those lows. This tells you buyers are consistently stepping in at higher prices—a clear sign of increasing bullish pressure.
A flat top breakout is a bit more flexible. The price action below the resistance can be messier and doesn't need to form that perfect rising slope. The defining feature is simply that clean, horizontal resistance line that has held the stock back multiple times. Think of it this way: the ascending triangle shows a methodical climb, while the flat top shows a persistent fight at one specific price level.
How Long Should I Hold a Stock After It Breaks Out?
This is where your personal trading plan becomes crucial. There's no magic number here, but a few proven exit strategies can guide you. It all comes down to your goals and risk tolerance.
The Swing Trader's Target: Many traders who focus on growth stocks aim for a 20-25% gain. Once they hit that target, they sell the entire position and move on. It’s a simple, disciplined approach.
Letting Your Winner Run: You could also use a technical guide, like a moving average. A popular rule is to hold the stock as long as it closes above its 21-day exponential moving average (EMA). If it closes below, you sell.
The Best of Both Worlds: Consider scaling out. You might sell half your position after a 15-20% gain to lock in some solid profit. Then, you can let the other half run with a trailing stop-loss to see if you can catch a much bigger move.
The bottom line is this: decide on your exit strategy before you place the trade. When real money is on the line and emotions are high, you need to rely on your plan, not your gut.
Can I Trade These Breakouts in Any Market?
Technically, yes, but your odds of success will swing wildly depending on the market's overall health. These are bullish patterns, and they thrive in a healthy bull market where the major indexes are trending up. Trading with that wind at your back makes everything easier.
In a choppy, range-bound market, breakouts are notorious for failing. There just isn't enough conviction to sustain the move.
And trying to trade a flat top breakout to the upside during a confirmed bear market? That’s an uphill battle you’ll rarely win. You're fighting the dominant market trend, which is a recipe for getting stopped out over and over again.
What Do I Do If a Breakout Fails?
When a stock breaks out and then quickly slams back down below the resistance level, that’s a failed breakout. This is your cue to get out, immediately.
Your stop-loss exists for this exact scenario. Don't second-guess it or hope for a miraculous recovery. If the price closes back inside the base, especially on a surge of volume, it’s a clear sign that sellers have overpowered the buyers. Your trade idea is now invalid.
Take the small, controlled loss and start looking for the next opportunity. Sometimes a stock will shake everyone out and then set up again, but that's a new trade. Close out the failed one first, and reassess with a clear head.
At Channeling Stocks, our entire focus is on spotting repeatable patterns like these inside clear price channels. We provide curated weekly lists and practical education to help you find high-probability setups like the flat top breakout with confidence. Start your free 14-day trial to see how we can save you research time and sharpen your trading edge.