
Staring at your first stock chart can feel like trying to read a foreign language. All those jagged lines, flashing colors, and cryptic symbols look more like a heart monitor than a financial tool. It’s intimidating.
But here’s the secret: every chart tells a story using just a few core parts. Once you know what to look for, you can start to understand the narrative behind any stock's price movement. It’s less about being a math genius and more about learning to spot patterns.
Think of it like the dashboard in your car. Before you can drive, you have to know where the speedometer and fuel gauge are. A stock chart is no different.
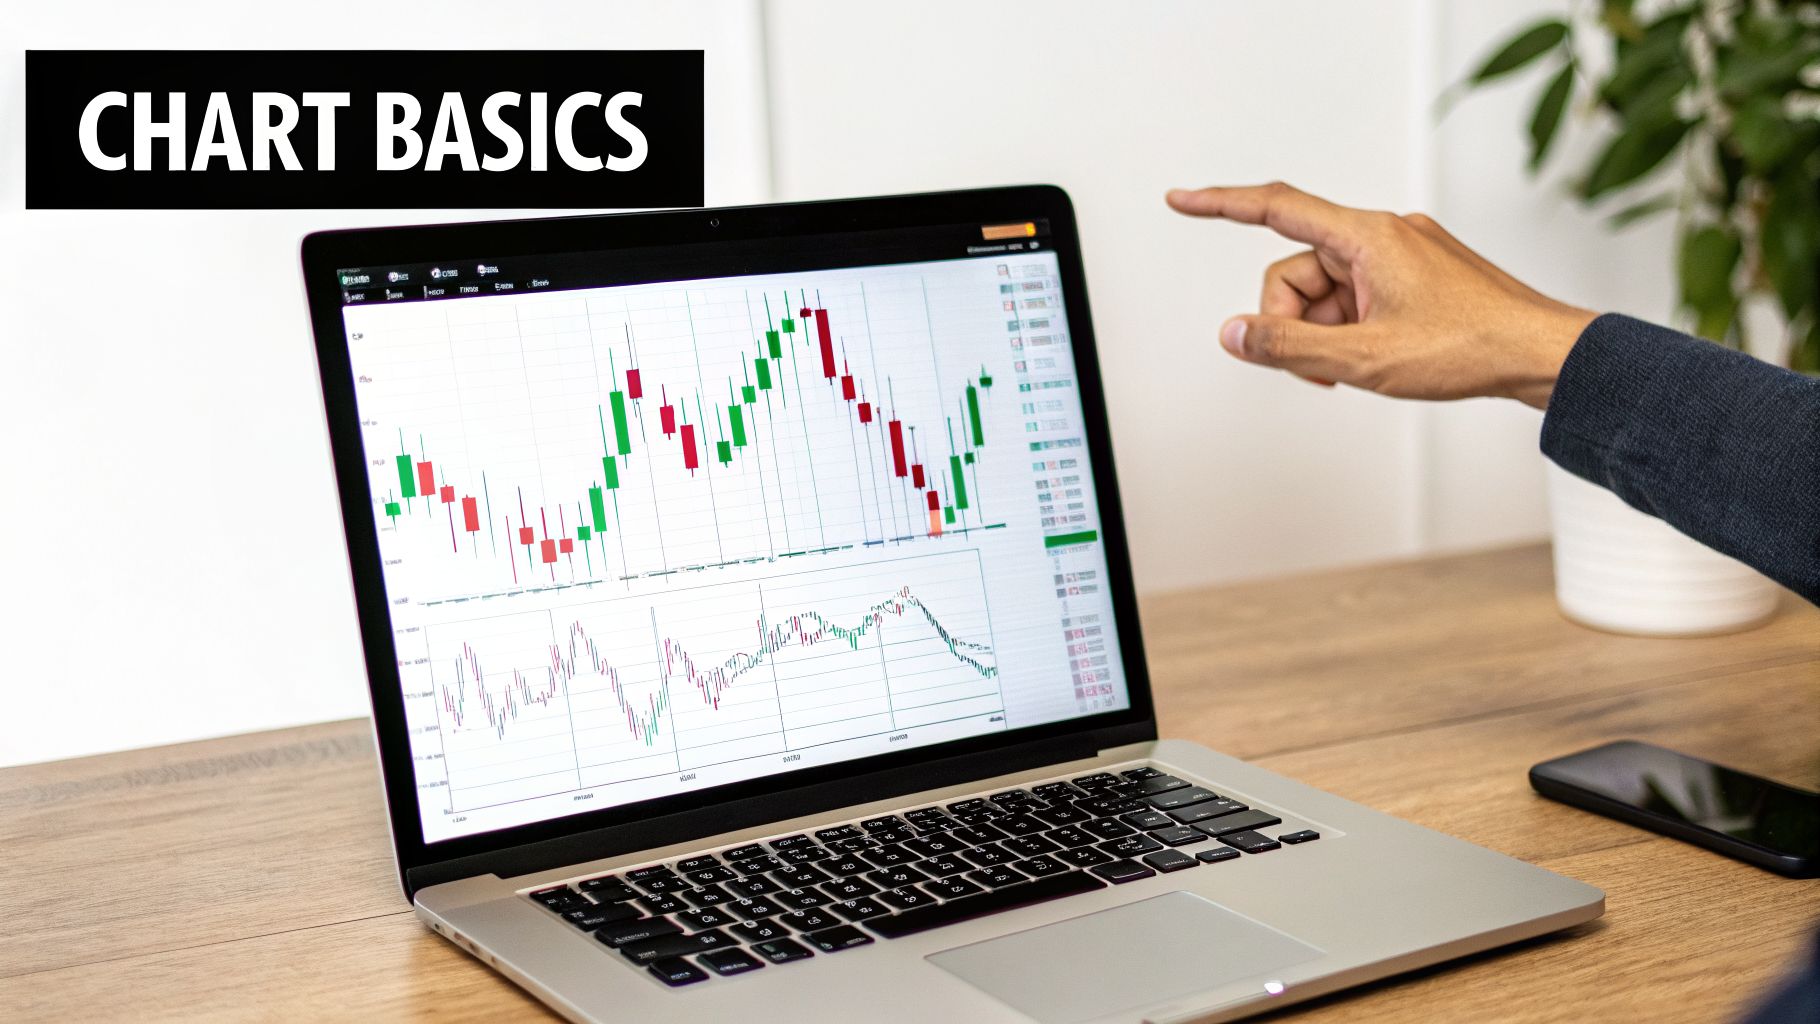
The Anatomy of a Stock Chart
No matter what platform you're using—whether it's TradingView or the one built into your brokerage account—every chart is built on the same foundation. Let's get our bearings.
- Stock Ticker: You'll almost always find this in the top-left corner. It’s the company's unique code, like AAPL for Apple Inc. or TSLA for Tesla.
- Price Axis (Y-axis): Look to the vertical axis on the right. This is your price scale. As the chart moves up, the price is rising; as it moves down, the price is falling. Simple as that.
- Time Axis (X-axis): The horizontal axis along the bottom is your timeline. This is where you control the story's scope, adjusting from a few minutes to several years.
These three elements give you the basic context: what company you're looking at, how much its price changed, and when it happened.
Choosing Your Chart Type and Timeframe
Once you've got your bearings, you need to decide how you want to see the price data. While there are a few options, most traders and investors quickly settle on one.
You might see a simple line chart, which just connects the closing price from one period to the next. It’s clean but hides a lot of the action. This is why most people quickly graduate to candlestick charts. In fact, some studies show that 70-80% of educational material for new investors focuses on daily candlestick charts for a reason.
Each "candle" gives you four critical pieces of information for a given period: the open, high, low, and closing price. This paints a much richer picture of the battle between buyers and sellers. You can learn more about why starting with candlesticks builds stronger analytical skills by exploring this guide on how to read stock charts for beginners.
To get you started, here's a quick rundown of the most common chart types.
Three Main Stock Chart Types Compared
| Chart Type | What It Shows | Best For | Beginner Friendliness |
|---|---|---|---|
| Line Chart | A single line connecting the closing prices over a set period. | Seeing the big-picture trend at a quick glance without any "noise." | ★★★★★ (Very Easy) |
| Bar Chart | Shows the open, high, low, and close (OHLC) with a vertical line and small horizontal ticks. | Getting detailed price action for each period, similar to candlesticks. | ★★★☆☆ (Moderate) |
| Candlestick Chart | Shows the same OHLC data as a bar chart but uses a colored "body" to make it easier to see if the price went up or down. | The go-to for technical analysis. The visual format makes patterns much easier to spot. | ★★★★☆ (Recommended) |
For our purposes, we'll be focusing almost exclusively on candlestick charts. They are the industry standard for a reason—they simply give you the most information in the most intuitive format.
The timeframe you choose is just as important, and it really comes down to your personal strategy. A long-term investor might look at a weekly or monthly chart to zoom out, while a day trader lives on the 5-minute or 15-minute charts. For anyone just starting out, the daily chart is the perfect place to begin. It filters out the intraday noise while still giving you plenty of data to analyze.
What Every Candlestick Is Trying to Tell You
Alright, you've got your candlestick chart pulled up. Now it's time to learn the language of the market. Every single candle on that chart is a visual story of the tug-of-war between buyers (the bulls) and sellers (the bears) over a set period. Getting a feel for this is probably the single most important skill you can build as a new trader.

Think of it like this: if the chart is a book, each candle is a word. You can't understand the story by looking at just one word—you need to see how they form sentences and paragraphs to grasp the full narrative.
The Anatomy of a Single Candle
Each candlestick gives you four key pieces of information at a glance, broken down into three main parts. Understanding what they represent is your first step toward reading the action.
- The Real Body: This is the thick, rectangular part. It tells you where the stock opened and where it closed for that period.
- The Upper Wick (Shadow): The thin line sticking out of the top of the body. It marks the highest price the stock hit.
- The Lower Wick (Shadow): The thin line at the bottom. This shows the lowest price the stock reached.
The color of the body is your instant emotional read. It tells you who won the day.
Bullish vs. Bearish Candles Explained
Color tells the story of price direction. Most platforms use green for up and red for down, but the key is knowing what the colors mean.
| Candle Type | Common Color | What It Means |
|---|---|---|
| Bullish Candle | Green (or White) | The closing price was higher than the opening price. Buyers took control. |
| Bearish Candle | Red (or Black) | The closing price was lower than the opening price. Sellers were in charge. |
A big, long green body shouts strong buying pressure. A long, solid red body signals heavy selling. It's a simple, powerful visual that you'll learn to recognize instantly.
A common trap for new traders is obsessing over a single candle. A candlestick gets its true meaning from context—where does it appear in a trend, and what are the candles next to it doing?
Reading the Wicks for Deeper Insights
The wicks, or shadows, tell the story of the fight. They show you the price levels that were tested during the session but ultimately rejected by the close.
For example, a candle with a tiny body and a really long upper wick tells an interesting story. It means the buyers tried to run the price way up, but sellers came in hard and slammed it back down. That’s a sign of selling pressure, even if the candle itself is green.
On the flip side, a long lower wick shows that sellers tried to tank the price, but buyers swooped in and propped it back up. This hints at underlying buying interest. The wicks reveal where the real battles were fought.
Simple Patterns That Signal Change
Once you can read one candle, you can start seeing simple patterns made of two or three candles that often hint at a shift in momentum. You don't need to memorize a hundred patterns; just start with a couple of the most reliable ones. For a closer look, our guide on how to spot cup and handle patterns is a great next step.
Here are two of the most important patterns for any beginner to learn:
- The Engulfing Pattern: This is a powerful two-candle reversal signal. A bullish engulfing pattern forms when a small red candle is completely swallowed up by a large green candle that follows it. It's a sign that buyers have wrestled control from sellers and could mean a downtrend is ending.
- The Doji: This candle looks like a cross or a plus sign because its body is just a thin line. This happens when the open and close prices are almost exactly the same. A Doji screams indecision. Neither buyers nor sellers could win. When you see one after a long run-up or sell-off, it’s a major warning that the trend could be losing steam.
Learning to read candlesticks isn't about having a crystal ball. It’s about learning to read the psychology of the market and understanding the story of supply and demand as it unfolds right on your screen.
Identifying the Market's Direction with Trends and Channels
Alright, so you’ve got a handle on what individual candlesticks are telling you. Now it’s time to zoom out and see the bigger story they’re creating together. One of the first and most important lessons in trading is simple: don't fight the trend.
A stock chart rarely, if ever, moves in a perfectly straight line. Instead, it ebbs and flows in a series of waves. These waves create patterns that clearly show who’s in control over a period of time—the buyers (bulls) or the sellers (bears). Your job is to learn how to read this flow.
The Three Basic Market Moods
At any given moment, every stock chart is in one of three states. Figuring out which one you're looking at is the absolute foundation for any kind of technical analysis.
Uptrend: This is what you see when buyers are firmly in charge. The chart will print a series of higher highs (each price peak is higher than the last one) and higher lows (each valley is higher than the one before it). It looks a lot like climbing a staircase.
Downtrend: Here, the sellers have the upper hand. The price action will show a distinct pattern of lower highs and lower lows. This is the staircase going down.
Consolidation (or Sideways Market): Sometimes, there's a standoff. Neither buyers nor sellers can gain meaningful ground, and the price just bounces between a fairly predictable high and low. This signals a period of indecision in the market.
Knowing the overall trend gives you critical context. For example, a powerful bullish candle pattern is a much more reliable signal if it appears at the bottom of a pullback in a healthy uptrend, rather than popping up randomly in a choppy, sideways market.
How to Draw and Use Trendlines
Once you can spot a trend, the next move is to make it concrete by drawing a trendline. A trendline is just a simple line you draw on your chart to connect key price points, giving you a clear visual boundary for the market’s direction.
But it’s not just about connecting random dots. There’s a right way to do it.
- In an Uptrend: You'll draw your line to connect at least two of the major lows (the "valleys"). This line then acts as a dynamic floor, or support.
- In a Downtrend: You'll connect at least two of the major highs (the "peaks"). This line becomes a dynamic ceiling, or resistance.
The golden rule here is the "two-touch" rule. A trendline isn't really considered valid until the price has hit it and bounced off it at least twice. Every time the price touches and respects that line again, the trendline becomes stronger and more significant. A clean break of a well-established trendline is a big deal—it often signals that the momentum is shifting.
Pro Tip: Don't try to force a trendline to fit your idea of what the chart should be doing. If you have to slice through the bodies of several candles to make your line connect, it's probably not a valid trendline. The best ones are clean, obvious, and connect the wicks of the major swing points.
Taking It a Step Further with Channels
A single trendline is useful, but you can get an even clearer picture of the action by drawing a price channel. A channel is simply two parallel trendlines that contain most of the price movement.
Think about an uptrend. You've already drawn the main trendline connecting the lows (your support). To create a channel, you just draw a parallel line that connects the highs. Now you've got a "channel" that the stock price is flowing through.
This is incredibly practical because it helps you anticipate where the price might be headed next.
- In an uptrending channel, the bottom line is your potential "buy zone," while the top line is a logical area to think about taking profits.
- In a downtrending channel, the top line acts as resistance and a potential "sell zone," while the bottom line is where the price might find some temporary support.
Channels give you a real framework for making decisions. Instead of just guessing, you now have defined boundaries where you can expect other traders to step in. This whole idea of price flowing between established levels is key to many trading strategies. If you want to go deeper, you can learn more about how rolling stock prices behave within these kinds of ranges.
By getting comfortable with trends and channels, you stop just looking at a chart and start interpreting the market's language. It turns a chaotic screen of red and green into a map with clear paths and boundaries.
Using Key Indicators to Confirm Your Analysis
Once you’re comfortable spotting trends and drawing channels, it's time to add a few simple tools to your chart. Think of technical indicators as your co-pilot. They shouldn't be flying the plane, but they're incredibly useful for confirming what you're already seeing and adding an extra layer of confidence to your analysis.
One of the biggest mistakes beginners make is cluttering their charts with dozens of flashy indicators, hoping one will magically predict the future. This almost always backfires, leading to confusion and "analysis paralysis" when conflicting signals make it impossible to act.
The smart approach? Start with just a few of the most reliable and easy-to-understand indicators.
Gauging Conviction with Trading Volume
Volume is probably the most underrated tool you have. It’s those vertical bars at the bottom of your chart, and trading volume simply shows how many shares changed hands in a given period. It's a direct measure of how much conviction is behind a price move.
A price jump on high volume is like a statement made with a loud, clear voice—it carries weight. A move on low volume is more like a whisper; there isn't much force behind it, and it could easily reverse.
Here's how to use this in the real world:
- Confirmation: If a stock breaks out above a key resistance level and you see a huge spike in volume, that’s a powerful sign the breakout is for real.
- Weakness: If a stock is slowly drifting higher but the volume bars are shrinking day after day, that's a red flag. The trend might be running out of gas.
Key Takeaway: Always glance at the volume. A price move without volume is a warning. A price move with volume is a confirmation.
Smoothing Out the Noise with Moving Averages
A Moving Average (MA) is a brilliantly simple tool that smooths out price action to show you the underlying trend more clearly. It calculates the average price of a stock over a set number of periods and plots it as a single, flowing line right on your chart.
For instance, a 50-day moving average displays the average closing price over the last 50 trading days. This filters out the daily volatility and gives you a much cleaner picture of the intermediate-term trend.
Here are a couple of practical ways to use them:
- Trend Direction: Is the MA line sloping up or down? It’s an instant, objective read on the trend. If the price is consistently staying above a rising MA, you're in a healthy uptrend.
- Dynamic Support and Resistance: In a strong trend, the moving average itself will often act as a moving floor (support) or ceiling (resistance). It’s common to see a stock pull back to its MA, touch it, and then bounce. These bounces can be great, high-probability entry points.
You can play around with different lengths, but the 50-day and 200-day moving averages are the two most-watched MAs on Wall Street, followed by institutions and retail traders alike.
Spotting Overbought and Oversold Conditions with RSI
The Relative Strength Index (RSI) is what's known as a momentum oscillator. It shows up in its own little window below your price chart and measures the speed and magnitude of price changes on a scale of 0 to 100. Its main job is to help you spot when a stock might be overbought or oversold.
Think of a stock's price like a rubber band. Stretch it too far in one direction, and the tension builds for it to snap back. The RSI helps you see that tension.
- Overbought: A reading above 70 is generally considered overbought. It doesn't guarantee the stock will immediately drop, but it signals that the rally might be getting overheated and is due for a pause or pullback.
- Oversold: A reading below 30 is considered oversold. This suggests that recent selling has been too aggressive and the stock could be due for a bounce.
The most powerful signals from the RSI often come from something called divergence. For example, if the stock price grinds to a new high but the RSI makes a lower high, it's called bearish divergence. This is a subtle but potent warning that the upward momentum is starting to fade.
Volume analysis stands out as one of the most powerful tools in stock chart reading, with trading volume often spiking by 40-300% during major announcements. Financial research has shown that integrating volume confirmation into a trading strategy can improve win rates by approximately 15-25% compared to using price patterns alone. This is because high volume during an uptrend suggests strong buying interest, whereas a price move on low volume often proves to be a false signal. You can explore more insights on how Stash explains reading a stock chart to deepen your understanding.
A Real-World Chart Walkthrough: Tying It All Together
Reading all the theory is one thing, but the real magic happens when you apply it to a live chart. This is where you learn to see the story the market is telling—weaving together trends, price action, and indicators to build a solid trading plan.
Let's walk through a stock chart together, building the analysis layer by layer, just like a seasoned trader would. We'll start with the big picture and then zoom in on the details to see if a trading opportunity is really there.
First, See the Forest: The Trend and Channel
Before you even think about indicators or patterns, you have to get your bearings. Zoom out. What’s the primary direction of the stock? Is it marching uphill, sliding downhill, or just chopping around sideways?
For our example, let's say the chart is clearly printing a series of higher highs and higher lows. That's our uptrend. The very next thing I do is make that trend tangible by drawing a price channel. I'll connect two or more of the major swing lows to create the support trendline, then draw a parallel line connecting the highs to define the resistance.
Just like that, we have a roadmap. The area down near the lower trendline becomes a potential "buy zone," while the upper line is where we’d expect sellers to show up. This simple act brings order to the chaos. If you want to really nail down how to find these levels, our deep dive on a support and resistance trading strategy is the perfect next step.
Zoom In: What Are the Candlesticks Saying?
With our channel mapped out, we can now focus on what's happening at these critical boundaries. Imagine the price is pulling back and getting close to our support trendline. This is where you need to pay close attention.
We’re not just going to buy blindly because the price is near a line on the chart. We need confirmation. Zooming in, we look at the daily candlesticks. Are they long, angry red candles, telling us sellers are still in complete control? Or is the momentum slowing down?
Maybe we see a Doji candle—a classic sign of indecision—followed by a big, bullish engulfing candle. That's the signal we're looking for. It’s the market telling us that buyers are stepping in with force, right where we expected them to.
This is where you can start layering in other tools to confirm what you're seeing in the price action.
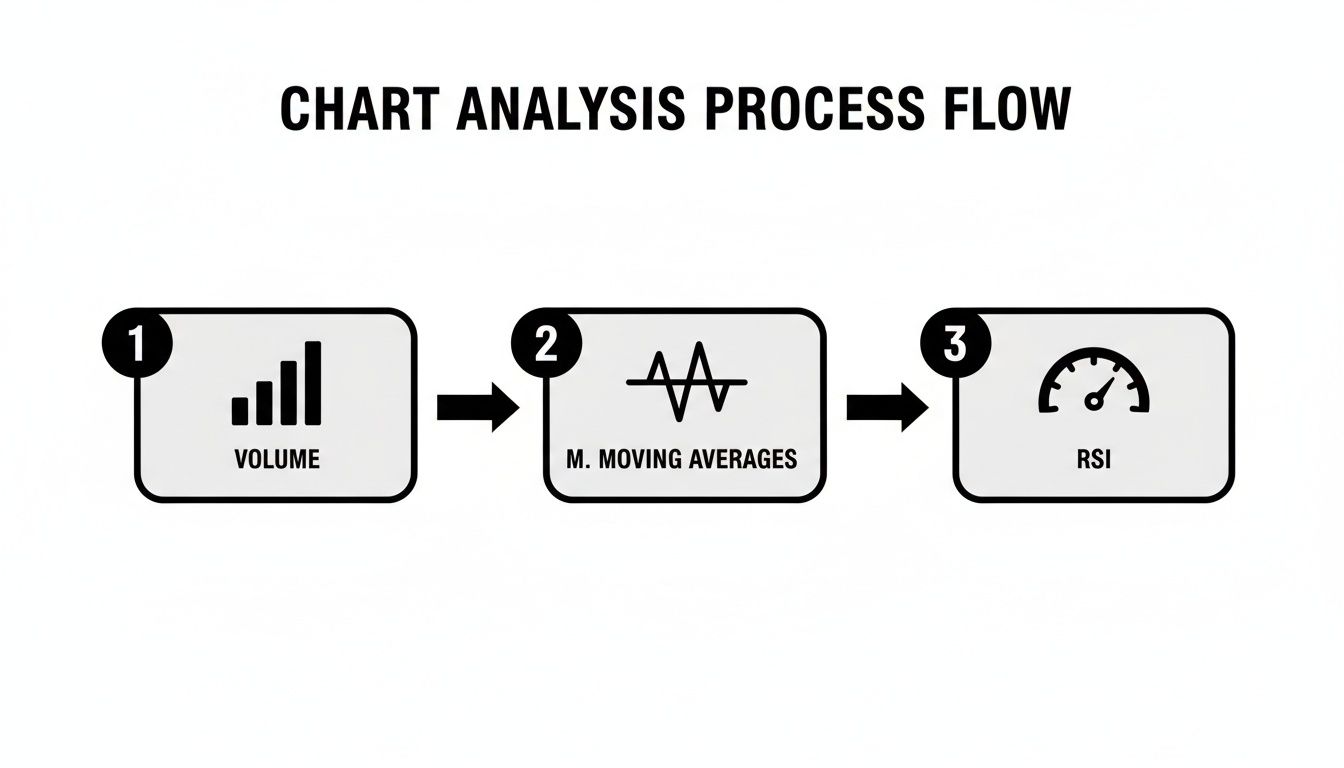
Think of indicators as your backup. They shouldn't be the primary reason for a trade, but they are incredibly useful for adding weight to your analysis.
The Final Check: Adding Indicators for Confirmation
Now we bring in our "co-pilots" to see if they agree with our bullish idea.
Volume: Look at the volume bars at the bottom of the chart. As the price bounced and formed that bullish candle, did volume spike? A surge in volume is a huge tell—it confirms there was real conviction and buying pressure behind that move.
Moving Averages: What if our 50-day moving average is also sloping upwards and happens to be right at the same level as our support trendline? This is what traders call "confluence," and it makes that support level significantly stronger. The price is now bouncing off two key levels at once.
RSI (Relative Strength Index): Now, glance down at the RSI. During the pullback, did it dip near or below the 30 level, into "oversold" territory? If the RSI is starting to hook back up from an oversold reading just as the price bounces, it's another powerful sign that the sellers are exhausted.
Putting it all together, you can form a clear, concise thesis for the trade.
My Trading Thesis: "The stock is in a defined uptrend and has pulled back to a confluence of support (the lower trendline and the 50-day MA). We're seeing confirmation with a bullish engulfing candle on a spike in volume, and the RSI is turning up from oversold. This presents a high-probability setup for the uptrend to resume."
One last piece of context I always add is the 52-week range—the highest and lowest price a stock has hit in the last year. This isn't just trivia; it's a powerful benchmarking tool. In fact, some studies have shown that stocks trading near their 52-week lows have historically outperformed those near their highs by 8-12% over the next year. Knowing this range helps you immediately judge if the channel you've identified is happening at a historically significant price level.
By layering your analysis like this—from the broad trend down to the specific candlestick and indicator signals—you stop just looking at charts and start truly reading them. You're building an evidence-based case for every single trade you consider.
Common Questions About Reading Stock Charts
Jumping into chart analysis always kicks up a lot of questions. It's totally normal. Getting those questions answered clearly is the key to building a solid foundation and dodging the common mistakes that trip up most new traders. Let's tackle the questions I hear the most.
What Is the Best Timeframe for a Beginner?
If you're just starting out, stick with the daily timeframe. Hands down, it's the best place to learn. Each candlestick on a daily chart represents one full day of trading, which does a fantastic job of filtering out all the frantic, confusing noise you see on shorter timeframes like the 1-hour or 15-minute charts.
Working with the daily chart gives you a much cleaner view of the stock's real trend. It makes spotting important support and resistance levels far more reliable, and you're less likely to get faked out by a sudden, meaningless price spike. Once you get comfortable there, you can zoom out to a weekly chart to see the big picture or zoom in to an hourly chart if you need a closer look.
How Many Indicators Should I Put on My Chart?
Less is more. I can't stress this enough. One of the biggest mistakes beginners make is piling on five, six, or even more indicators, thinking they'll uncover some secret formula. In reality, this just leads to "analysis paralysis"—a frustrating state where you're so overwhelmed by conflicting signals that you can't make a decision.
A clean chart is a clear chart. Your primary focus should always be on the price action itself. Indicators are there to confirm what you see, not to tell you what to do.
A great starting point is to use just one or two indicators that work well together.
- Trading Volume: This is a must-have. It tells you how much conviction is behind a price move.
- A Moving Average (like the 50-day): It's perfect for quickly confirming the overall trend direction.
Don't even think about adding more than three indicators until you truly understand what each one is telling you and how it helps you analyze the price and trend.
How Can I Practice Without Risking Money?
The absolute best way to sharpen your skills is through paper trading. This is basically a trading simulator that uses real market data. You can practice reading charts, testing strategies, and managing risk without putting a single dollar on the line.
To get the most out of it, you have to treat it like it's real. Keep a trading journal for your simulated trades. Write down why you entered a trade, what your plan was, and what the outcome was. This habit helps you look at your wins and losses without emotion, so you can actually learn from them and get better.
Another great exercise is to practice on historical charts. Pick a stock, go back a year on the chart, and cover up everything to the right of your screen. Based on what you can see, decide what you would do. Then, slowly reveal the rest of the chart to see what actually happened.
Ready to stop guessing and start practicing? At Channeling Stocks, we provide weekly curated lists of channeling stocks and a full paper-trading platform to help you build confidence. Test your new chart reading skills and rehearse your strategy with realistic numbers before you risk any capital. Start your two-week free trial today and see how focused research can make a difference.