
At its heart, a support and resistance trading strategy is beautifully simple. Traders look for historical price levels where a stock repeatedly struggles to move higher (resistance) or lower (support). The entire game plan revolves around using these well-defined zones to make decisions. The classic approach is to buy near support and sell near resistance, betting that these boundaries will once again hold firm. It's one of the most powerful and time-tested concepts in all of technical analysis.
Understanding How Support and Resistance Drive the Market
To really make this strategy work, you need to see beyond the lines on a chart. Support and resistance levels aren’t just arbitrary price points; they represent the collective memory and emotional tug-of-war between buyers (bulls) and sellers (bears).
Think of it like a ball bouncing between a floor and a ceiling. The floor is your support level—a price where buyers consistently show up, overpowering sellers and pushing the price back up. At this point, demand outstrips supply. The ceiling, on the other hand, is your resistance level. This is where sellers take charge, flooding the market with shares and causing the price to retreat.
The Psychology of Price Levels
These levels aren't magical. They are a direct result of human behavior and the flow of buy and sell orders.
Support: This is an area of perceived value. Buyers who felt they missed an earlier run-up see a dip to this level as a second chance to buy at a "good" price. At the same time, existing shareholders might use the dip to add to their positions, strengthening that price floor.
Resistance: This is a zone where a stock is seen as expensive. Traders who bought lower are now looking to cash in their profits. Simultaneously, short-sellers view it as a prime opportunity to bet against the stock, which adds even more selling pressure.
This cycle of behavior creates a powerful self-fulfilling prophecy. The more traders recognize and trade off these levels, the stronger and more reliable they tend to become.
The chart below perfectly illustrates how price can respect these zones, bouncing cleanly between the support floor and the resistance ceiling.

The real insight here is that these levels give us a framework for making objective trades based on behavior the market has shown us before.
To make this even clearer, here's a quick side-by-side comparison.
Support vs. Resistance at a Glance
This table breaks down the core differences in market psychology and function between these two critical levels.
| Attribute | Support Level | Resistance Level |
|---|---|---|
| Price Action | Acts as a price "floor" | Acts as a price "ceiling" |
| Dominant Force | Buyers (Demand) > Sellers | Sellers (Supply) > Buyers |
| Trader Psychology | Fear of missing out (FOMO), perceived value | Profit-taking, perceived overvaluation |
| Trader Action | Ideal area to look for buy entries | Ideal area to look for sell/short entries |
Understanding this dynamic is the first step to truly internalizing the strategy.
Why Some Stocks Are Easier to Trade
This brings us to what we call "channeling stocks." These are equities that have a history of moving gracefully and predictably between support and resistance, trading in a well-defined range or channel. Finding these predictable stocks is the first, most crucial step in building a reliable trading routine.
This isn't just theory; the data backs it up. A five-year study found that levels tested three or more times showed a 72% higher probability of holding. This confirms what experienced traders already know: the more a level is tested and respected, the more significant it becomes.
Key Takeaway: Support and resistance levels are not just lines on a chart; they are visual representations of supply and demand dynamics. They mark the points where the market's psychological tug-of-war is most intense.
Ultimately, learning to read these levels is what elevates trading from a game of guesswork to a strategic exercise. You stop reacting to every market whim and start anticipating high-probability moves based on historical precedent.
How to Find and Validate Actionable Trading Levels
Finding reliable support and resistance isn't about scribbling random lines on a chart. It’s a skill, and like any skill, it takes practice to move from guessing to making strategic, high-probability trades. Let's get practical and look at how to spot the levels that actually matter.
The simplest place to start is by connecting the dots on your chart. Look for at least two or three significant turning points—the peaks (swing highs) or valleys (swing lows)—that line up at roughly the same price. A horizontal line connecting these points is the first step to mapping out the market's memory.
Think in Zones, Not Lines
Here’s a critical mindset shift that separates amateur traders from seasoned ones: stop thinking in terms of precise lines and start thinking in price zones. A stock almost never reverses at the exact same cent. Market noise, stop-loss hunts, and big institutional orders create a buffer around that core price level.
If you draw a single line at $50.00, you’re setting yourself up to be shaken out when the price briefly dips to $49.85 before roaring back up. Instead, see it as a support zone, maybe from $49.75 to $50.25. This gives your trade room to breathe and helps you stay in positions that are still perfectly valid.
Here’s how I build my zones on a chart:
- First, I identify the core level by connecting the most obvious swing points.
- Next, I check the candle wicks that poked through that level. The tips of those wicks help me define the outer edges of the zone.
- Finally, I look at the candle bodies. The area where candles consistently open or close is often the strongest part of the zone, where the real battle was fought.
This simple method creates a much more realistic and resilient framework for your trading, helping you filter out the market's everyday noise.
Choose the Right Timeframe to See the Bigger Picture
For any swing or wave trader, the daily and weekly charts are your bread and butter. Why? Because levels identified on these higher timeframes carry far more weight. They represent a long-term consensus among a huge pool of market participants.
The shorter your timeframe, the more "noise" you'll see. A level that looks like a brick wall on a 5-minute chart might be nothing more than a tiny blip on the daily chart. Always start your analysis on the daily or weekly to find the major structural levels dictating the stock's overall trend. Only then should you zoom in to a 4-hour or 1-hour chart to pinpoint your entry.
Trader's Insight: The best setups appear when a level is clear on the weekly, daily, and 4-hour charts all at once. When multiple timeframes align, it means traders of all styles are watching the same area, which dramatically increases its predictive power.
This screenshot from our Channeling Stocks platform shows a perfect example. You can see a clear channel on the daily chart, with the stock predictably bouncing between well-defined support and resistance zones.
Notice how the price respected these boundaries for months, offering one clean trading opportunity after another. That’s the kind of predictable structure you can find when you focus on higher timeframes.
The Power of Role Reversal
One of my absolute favorite patterns is the principle of role reversal, sometimes called the polarity principle. It’s a simple but incredibly powerful concept.
- Broken resistance flips to become new support.
- Broken support flips to become new resistance.
This is a professional’s setup. Instead of chasing a stock as it blasts through resistance, you patiently wait for the pullback. You’re watching to see if it retests that old resistance level from above. If the price holds and bounces, you have a high-probability entry with confirmed strength. You can see more examples of this in action in our guide on identifying rolling stock prices.
This isn't just a chart pattern; it’s rooted in market psychology. For a real-world example, look at the NASDAQ 100 Index ($NDX) back in May 1997. Resistance at 935 was broken, and it then became rock-solid support. This new floor held through two retests and became the launchpad for a rally from 935 to 1,150—a 23% gain in the following months. Why does this work? Because old buyers are now defending it as a value area, and some studies suggest that in U.S. stocks, 68% of these flips successfully hold. For a deeper dive, the research on support and resistance level indicators on atas.net is a great read.
Other High-Impact Confirmation Factors
Beyond price action, a few other tools can add serious conviction to your levels.
High-Volume Congestion: Use a volume profile indicator. It shows you exactly where the most shares were traded in the past. These high-volume areas (or "nodes") act like price magnets and often form powerful support or resistance because so many traders have a stake at that price.
Psychological Round Numbers: Never underestimate human psychology. Big round numbers like $50, $100, or $200 are natural psychological hurdles where people tend to place buy and sell orders. When these numbers line up with your technical levels, it's a huge bonus.
The Number of Tests: A level gains strength each time it is tested and holds. The first touch could be random. The second shows the market is paying attention. By the third touch, you know you’ve found a major battlefield between buyers and sellers, and the level is confirmed.
How to Execute Trades Without Second-Guessing
Pinpointing a solid support or resistance zone is one thing. Actually putting your money on the line when price gets there? That’s a different game entirely. It’s where the analysis stops and the real-world pressure kicks in, often leading to hesitation and missed opportunities.
The only way to push past that indecision is with a crystal-clear plan of attack. You need to know exactly what you’re looking for and how you’ll react when you see it. It's not about predicting the future; it's about having a pre-defined response when the market tips its hand at your key levels.
Let's walk through the two core trade setups that form the backbone of this strategy. The entire validation process can be boiled down to a simple mental checklist.
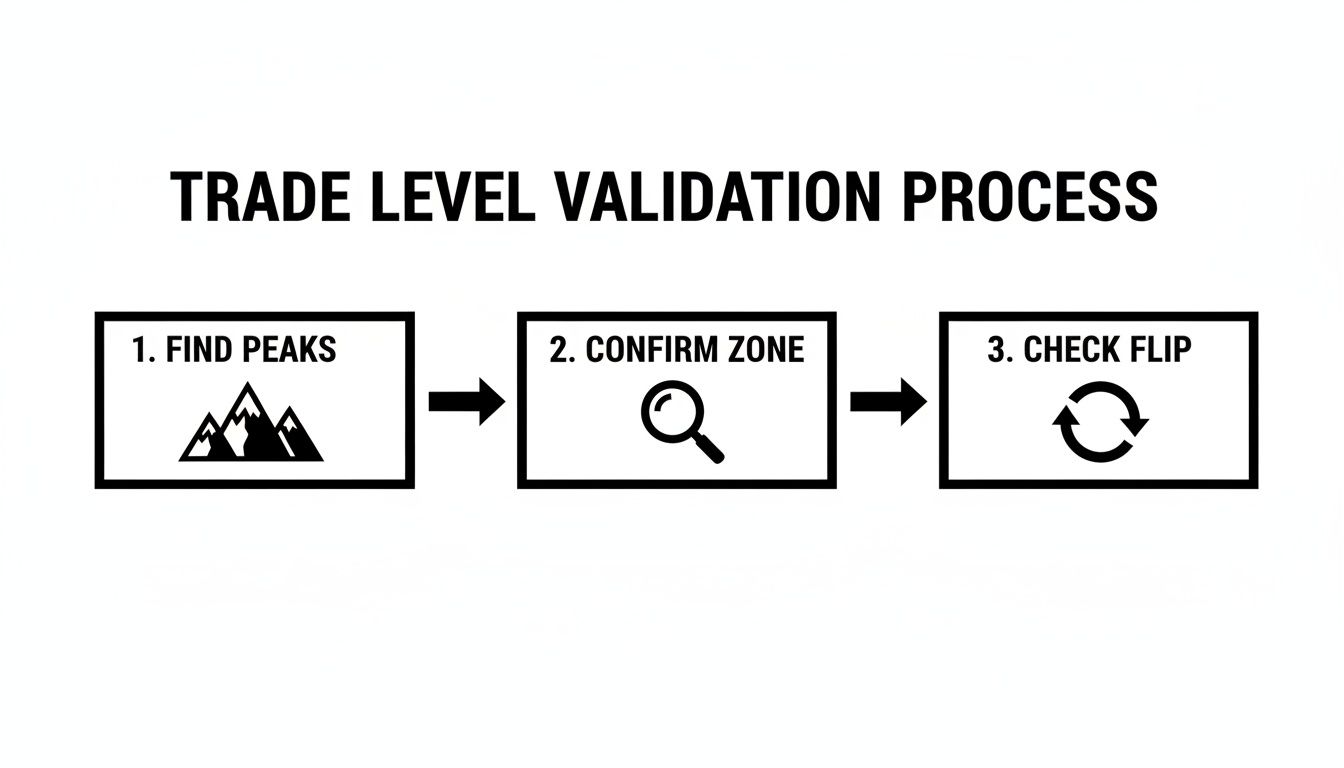
Think of it like this: you find the obvious turning points on the chart, make sure the zone has proven itself multiple times, and then watch to see if it holds or flips.
The Bounce: The Classic S/R Play
This is the bread and butter of support and resistance trading, often called the "Bounce." The idea is straightforward: you’re looking to buy as price dips into a proven support zone or sell short as it pushes into a strong resistance area. You're essentially betting on history repeating itself—that the level will hold firm once again.
But just lobbing in an order the second price touches your line is a rookie mistake. Price action is messy, and zones often see some overshoot. You have to wait for the market to give you a sign that other big players are actually defending the level. You need confirmation.
So, what does real confirmation look like on a chart?
- Bullish Candlestick Signals: When price hits your support level, you want to see patterns like a Hammer, a Bullish Engulfing bar, or a Morning Star. These are visual cues that buyers stepped in, absorbed the selling pressure, and are starting to push the price back up.
- Bearish Candlestick Signals: At resistance, you're looking for the opposite. A Shooting Star, a Bearish Engulfing candle, or an Evening Star formation tells you sellers have overwhelmed the buyers and are taking control.
- A Pop in Volume: A noticeable spike in volume as price hits your zone and reverses is a huge tell. It shows a significant battle took place at that price, and more importantly, it shows you who won.
My Two Cents: Patience is the most underrated skill in trading. Waiting for that confirmation candle to close might mean you don't nail the absolute bottom or top tick. Who cares? It dramatically stacks the odds in your favor and turns a gamble into a calculated trade with real evidence behind it.
Imagine a stock has a rock-solid support zone around $50. The price drops to $50.25 and prints a clean hammer candle on your 4-hour chart. That's your green light. The rejection is confirmed. Your entry trigger is the open of the next candle, with a protective stop-loss tucked just below the low of that hammer's wick.
The Breakout and Retest: The Power Shift
No level holds forever. When price finally smashes through a major resistance or crumbles below a key support, it’s a powerful signal that the market's supply-demand dynamic has fundamentally changed. We call this the "Breakout."
The common mistake is to chase the move, buying frantically as the price rockets higher. This is usually a recipe for getting a terrible entry, often buying the exact peak of the initial emotional spike right before a sharp pullback.
A much savvier approach is to wait patiently for the retest. Remember that role-reversal principle?
- Old resistance, once broken, tends to become new support.
- Old support, once broken, tends to become new resistance.
Instead of chasing the breakout, you let the dust settle and wait for the price to come back to the scene of the crime. If old resistance at $75 breaks, you don't buy at $77. You wait for the price to drift back down toward $75 and then look for confirmation that the level is now acting as a floor (a small bounce, a bullish candle, etc.).
Waiting for the retest does a few critical things for you. It confirms the breakout was legitimate and not a fake-out. It gives you a clear, logical spot for your stop-loss (right on the other side of the level). And it almost always offers a far superior risk-to-reward on your entry.
You can hone this patient mindset without risking a dime. Walking through these mechanics in a simulated environment using our paper trading examples is a great way to build the muscle memory and confidence needed to execute flawlessly with real money.
By defining your rules for both the Bounce and the Breakout/Retest, you take the emotion and guesswork out of your execution. You’ll know precisely what signal you’re waiting for, and when it appears, you can act decisively.
Protecting Your Capital With Smart Risk Management
Getting into a trade is exciting, I get it. But professional trading isn’t about the thrill of the entry; it’s about the discipline of survival. This is the exact spot where most new traders stumble. They get so wrapped up in finding the perfect entry that they completely forget the most important rule of the game: protect your capital at all costs.
The goal isn't to be right 100% of the time. That's a fantasy. The real goal is making sure that when you're wrong, the damage is small and completely manageable.

So, let's talk about a practical system for managing risk that you can bolt onto every single trade. This isn't theory; it's a concrete way to define your risk before you ever think about clicking the "buy" button.
Where to Place Your Stop Loss
Think of your stop-loss order as your non-negotiable exit plan. It’s the price you decide on before you enter a trade where you’ll take a small, planned loss to prevent a much bigger, unplanned one.
The most common mistake I see is traders placing stops based on some random dollar amount they're willing to lose. A much smarter way is to let the market itself tell you where the stop should go.
If you're buying at a support zone, your stop loss belongs just below that zone. If you're shorting at resistance, it goes just above. Simple. This is your invalidation point—the price that screams, "Hey, your trade idea was wrong!"
But here's the catch: placing it just a few cents below the line is a classic recipe for getting "wicked out" by normal market chatter. You have to give the trade some breathing room. This is where a fantastic little tool, the Average True Range (ATR) indicator, comes into play. You can find it on any decent charting platform like TradingView. The ATR simply measures a stock's average price movement over a set period, usually 14 days.
A Pro Tip From The Trenches: A solid rule of thumb is to place your stop 1.0 to 1.5 times the current ATR value away from the edge of your support/resistance zone. This respects the stock's natural volatility and helps you dodge those frustrating, premature stop-outs.
Calculating Your Position Size
Okay, you know where your stop loss is going. Now for the most important part of your risk plan: position size. This, not the stop loss, is what truly controls how much you can lose.
Your job is to decide on a fixed percentage of your entire trading account you are willing to risk on one trade. The professional standard, and one I strongly recommend, is between 1% and 2%. Never more.
Let's walk through a real-world example.
- Your Account Size: $25,000
- Your Max Risk Per Trade: 1%, which is $250
- The Stock: Let's say XYZ is trading at $50.50 right near a key support level.
- Your Entry Price: $50.50
- Your Stop-Loss Price: $49.75 (placed below support, with that ATR buffer we talked about)
First, figure out your risk on a per-share basis:
Risk Per Share = Entry Price – Stop-Loss Price = $50.50 – $49.75 = $0.75
Now, you can calculate the correct number of shares to buy:
Position Size (Shares) = Max Risk ($) / Risk Per Share ($) = $250 / $0.75 = 333 shares
By sticking to 333 shares, you've done something powerful. You now know, with mathematical certainty, that if this trade fails and hits your stop, you will lose exactly $250 (plus commissions). That's it. This removes the emotion and ensures that no single bad trade can ever cripple your account.
Smart Exit Strategies for Taking Profits
Knowing when to cash in your chips on a winning trade is just as vital as knowing when to fold a losing hand. We’ve all been there—letting greed turn a beautiful winner into a break-even trade, or worse. You need a plan.
Here are two effective ways to take profits within this strategy:
Target the Next Level: The most straightforward approach is to set your profit target at the next major area of opposition. If you bought off support, your primary target is the next clear resistance zone. This naturally builds in a positive risk-to-reward ratio. In our example, if the next resistance is at $52.00, your potential profit is $1.50 per share ($52.00 – $50.50). With a $0.75 risk per share, that's a perfect 2:1 reward/risk setup.
Use a Trailing Stop: When a stock is in a powerful trend, a trailing stop is your best friend. It lets your winner run while systematically protecting your profits. You could use a technical indicator like a moving average (the 20-period EMA is popular) or even a multiple of the ATR to trail your stop. As the price climbs, your stop-loss order automatically moves up with it, locking in more and more profit along the way.
When you combine a structurally-sound stop loss with calculated position sizing and a pre-planned exit strategy, you stop gambling and start running a business. This is the bedrock of any successful trading career.
Avoiding Common Pitfalls and Refining Your Edge
Let's talk about the part of trading that separates the pros from the perpetual beginners: mastering your own psychology. Having a solid support resistance trading strategy is one thing, but actually sticking to it when the market is trying its best to make you second-guess yourself is a whole different ballgame.
I've seen it a thousand times—and I've done it myself. The real battle isn't with the chart; it's the internal fight against greed, fear, and a crippling lack of patience. Those emotions are the real account-killers, urging you to bend the rules "just this once."
Key Insight: A winning trader isn't someone who found a magic, no-loss strategy. They're someone who built a rock-solid process and has the discipline to execute it, even when—especially when—it feels wrong.
This is the shift you have to make. Stop reacting to every little price flicker and start operating like a business owner, focused on solid execution and playing the long-term probabilities.
Overcoming Impulse-Driven Mistakes
The market is an emotional battlefield, and most traders are unarmed. The successful ones feel the same pull of FOMO and panic, but they’ve built systems to keep those impulses in the back seat. Here are the classic traps that you need to learn to sidestep.
Chasing Those Runaway Breakouts: You see a stock scream past a resistance level. Your heart pounds. FOMO kicks in, and you jump in with a market order, terrified of missing the move. Then, just as quickly, the price reverses, smacks your stop, and leaves you wondering what happened. The antidote is simple but not easy: patience. Let the amateurs chase. Your job is to wait for the pullback and see if that old resistance now holds as new support. A confirmed bounce there is your high-probability entry.
Jumping the Gun Without Confirmation: The price hits your support zone, and you immediately click "buy," trying to heroically catch the exact bottom. That's not trading; it's gambling. The professional approach is to wait for proof. Let the market show its hand. Look for a strong bullish candle to close, like a hammer or an engulfing pattern. That's your signal that other buyers are stepping in with conviction.
Moving Your Stop Loss (The Cardinal Sin): Your trade moves against you, and that red number on your screen gets bigger. Panic sets in. You think, "I'll just give it a little more room to breathe," and you drag your stop loss further down. This is, without a doubt, the fastest way to blow up an account. The fix is to treat your stop as sacred. You placed it based on sound analysis (e.g., just below the support structure). Once it's set, it's non-negotiable. Period.
These aren’t just minor slip-ups; they are catastrophic failures of discipline. They all come from a place of hope and fear, not from a well-defined plan.
Building Bulletproof Confidence Through Practice
You can’t build the discipline to avoid these mistakes just by reading about them. You need to forge it in a practice environment where the emotional stakes are low. This is exactly what backtesting and paper trading are for.
Backtesting is your time machine. You go back through historical charts and manually test your support resistance trading strategy. You’re not just looking for wins; you're getting a feel for a stock's unique personality. Does it respect levels cleanly? How often does it provide clear confirmation signals? This is where you gather the raw data that proves your edge exists.
Paper trading is your dress rehearsal. You're now applying your rules in a live market simulation, but without risking a single dollar. This is where you iron out the mechanics of placing orders, setting stops, and taking profits. Platforms like Channeling Stocks build this right in, so you can practice your entire workflow in a realistic setting. You build the muscle memory needed to act without hesitation when your real money is on the line.
This simple routine—backtest to find your edge, then paper trade to perfect your execution—is the secret. It provides the data-driven confidence you need to stay cool, calm, and disciplined when the market inevitably tries to throw you off your game.
Answering Your Top Questions About This Trading Strategy
Even the most well-defined strategy brings up questions once you start applying it to live markets. It’s a natural part of the process. Let’s tackle some of the most common ones I hear from traders who are getting started with support and resistance.
How Many Times Does a Price Need to Touch a Level for It to Be Valid?
This is a great question, and the honest answer is there's no single magic number. That said, I've found a level really starts to prove itself after three confirmed tests. The first hit could just be noise, but by the second and third, you're seeing a clear pattern of institutional memory and order flow.
Think of it like this: each time a level holds, it gets more attention. Other traders notice, and it becomes a more significant psychological barrier. The quality of the reaction matters, too. A sharp, decisive bounce carries a lot more weight than a weak, hesitant drift away from the level.
What Timeframe Is Best for Support and Resistance Trading?
The right timeframe really comes down to your personal trading style. If you’re a swing trader looking to hold positions for several days or weeks, the daily and weekly charts are your bread and butter. They give you the big picture and help you ignore the distracting intraday noise.
From there, you can drop down to a 4-hour or 1-hour chart to fine-tune your entry. On the other hand, if you're a day trader, you'll likely live on the 15-minute and 5-minute charts, playing the smaller bounces between more immediate levels.
Key Takeaway: The most powerful setups occur when multiple timeframes align. When you spot a clear level on the weekly, daily, and 4-hour charts simultaneously, you know traders of all stripes are watching that exact same area. That alignment dramatically boosts its reliability.
What Should I Do When a Support or Resistance Level Breaks?
A broken level isn't a failure—it's a new opportunity. This is where you see the principle of "role reversal" play out in real time. Old, broken resistance often becomes new support, and broken support has a strong tendency to turn into fresh resistance.
Resist the urge to chase a breakout. The professional approach is to wait patiently for the price to pull back and retest the broken level from the other side. A successful retest from the new direction gives you a much higher-probability entry and confirms the market has accepted the new price structure. This patience is a hallmark of a mature trading strategy.
Ready to stop guessing and start identifying high-probability trading channels? Channeling Stocks delivers weekly curated lists of stocks that respect these boundaries, along with the education and tools you need to trade them effectively. Explore our no-credit-card, two-week free trial and see the difference for yourself.