
When a stock has been falling for a long time, traders are always on the lookout for signs that the bottom is finally in. The triple bottom is one of the most classic and reliable signals that a major trend reversal might be just around the corner. It tells a clear story of sellers losing their nerve and buyers stepping in with conviction.
Unpacking the Triple Bottom Reversal
Think of it like a heavyweight fight. A dominant fighter (the sellers) has had the opponent on the ropes for several rounds. They try to land a knockout blow once, but the opponent (the buyers) hangs on. They try a second time, and again, no knockout. By the third attempt, the dominant fighter is visibly tired, and the opponent sees an opening.
That’s exactly what’s happening on the chart during a triple bottom.
- Sellers drive the price down to a specific level, but buyers show up to defend it.
- After a small rally, sellers try again, pushing the price back to that same level. Again, buyers hold the line.
- One last, desperate attempt by the sellers fails at the exact same spot. At this point, it’s clear their momentum is gone.
After that third failed test of the lows, buyers finally take control. They see the sellers are exhausted and push the price upward, this time with enough force to kick off a new uptrend.
The Anatomy of the Pattern
Spotting a triple bottom requires a keen eye for a few specific details. It’s not just any three dips; the structure is what gives the pattern its predictive power.
- Three Troughs: The most obvious feature is three distinct lows that all stop at roughly the same price. This price level becomes a very strong floor, what we call support.
- Two Intermediate Peaks: In between those three lows, the price bounces back up a bit, forming two smaller peaks.
- The Neckline: If you draw a straight line connecting the highs of those two intermediate peaks, you get the neckline. This line represents the final hurdle.
A confirmed breakout happens when the price closes decisively above that neckline. That’s the signal that the reversal is in play and a new bull run has likely begun. It’s conceptually similar to another powerful reversal pattern, which you can learn about in our guide on the inverse head and shoulders formation.
This isn’t just theory; it’s backed by data. The triple bottom is widely regarded as one of the more dependable reversal patterns out there. Backtesting studies consistently show it has a success rate of around 75% in leading to a sustained uptrend.
These patterns typically take 3 to 6 months to form, making them a favorite for swing traders looking to capture larger moves. A successful breakout can often lead to gains of 20-30%, calculated by measuring the height of the pattern from the lows to the neckline and projecting that distance upward.
To help you internalize the key features, here is a quick overview.
Triple Bottom Pattern at a Glance
The table below breaks down the essential characteristics you need to verify before trading this pattern.
| Characteristic | Description |
|---|---|
| Preceding Trend | Must occur after a clear, extended downtrend. |
| Trough Count | Exactly three distinct troughs at a similar price level. |
| Volume Behavior | Typically decreases during pattern formation, then surges on the breakout. |
| Pattern Type | Bullish Reversal (signals a potential shift from downtrend to uptrend). |
Memorizing these traits will help you quickly and accurately identify high-quality triple bottom setups as you scan through your charts.
What Makes a Triple Bottom Pattern Truly Reliable?
It’s one thing to spot the simple "W" shape of a potential triple bottom on a chart. It's another thing entirely to know if you're looking at a truly reliable signal or just random market chatter. The best patterns tell a clear story—a narrative of sellers finally giving up and buyers wrestling back control. Let's break down the anatomy of a high-quality setup.
First and foremost, a triple bottom needs a reason to exist. It must come at the end of a clear, established downtrend. This pattern doesn't just pop up out of nowhere; it’s a reversal formation that signals the potential end of a prolonged price decline. Think of it as the final, exhaustive battle after a long war. If you see this pattern forming in a sideways or uptrending market, it's not a triple bottom—it's likely just consolidation.
This diagram helps visualize the entire sequence, from the preceding downtrend to the final bullish breakout.
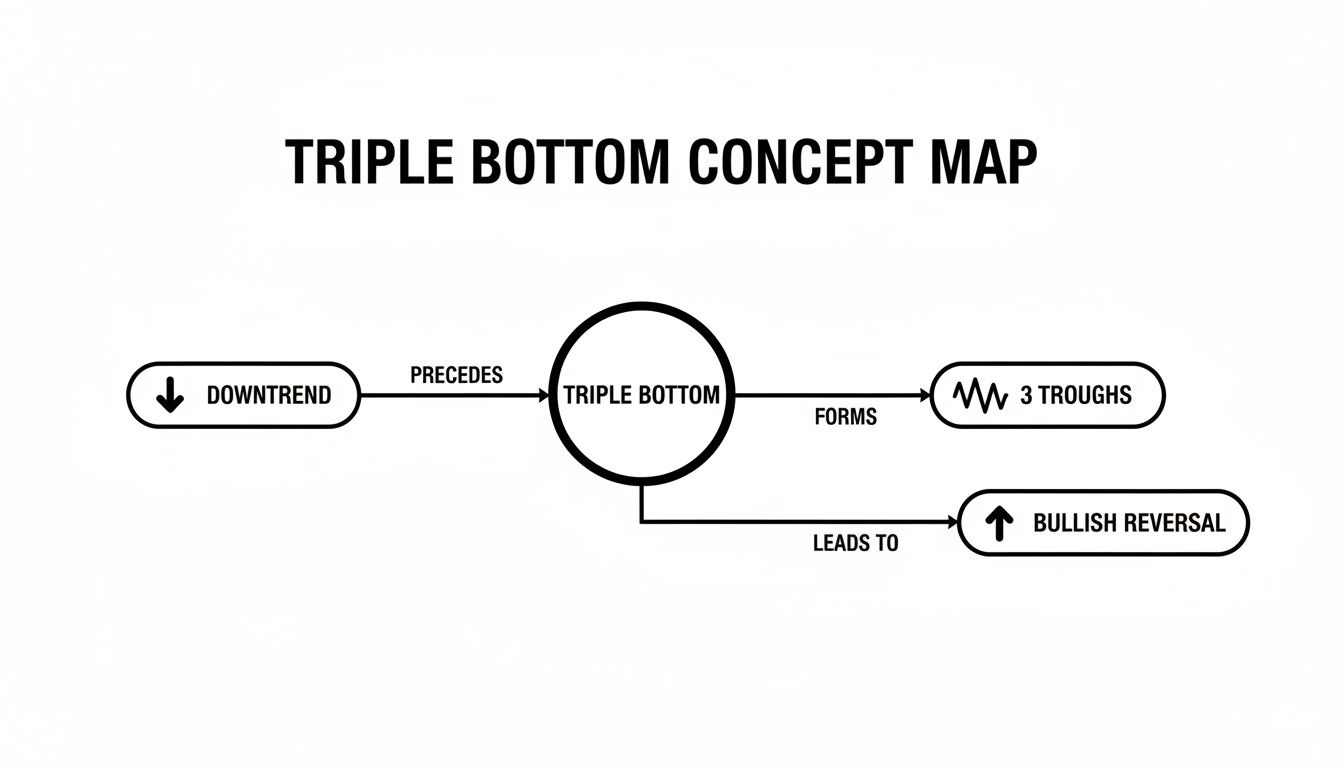
As you can see, the formation is a process, not a single event. It represents a gradual shift in power from sellers to buyers.
The Story Told by the Three Lows
At the core of this pattern are three distinct troughs that hammer out a bottom at roughly the same price. This shared low creates a powerful zone of support. What's happening here is pure market psychology in action:
-
The First Low: Sellers have been in control, but they finally push the price to a point where buyers see value. They step in and halt the decline, causing a temporary rally.
-
The Second Low: After the bounce, sellers try to resume the downtrend. But when the price returns to that previous low, the original buyers are still there, now joined by new ones who missed the first chance. They defend the level again, and the price bounces. This failure to make a new low plants a seed of doubt in the sellers' minds.
-
The Third Low: This is the moment of truth. Sellers make one last, desperate push. When they fail for a third time to break that support level, it's a massive psychological blow. Their exhaustion is palpable, and it signals to the market that the bears have run out of steam.
The triple test of this support floor is what gives the pattern its predictive power. Each failed breakdown erodes seller confidence while bolstering the conviction of buyers, paving the way for a strong reversal. You can dive deeper into how these price levels function in our guide to support and resistance trading.
The timing between these lows is also important. A good pattern doesn't feel rushed. Ideally, the entire formation unfolds over a longer period, often taking 3 to 6 months to complete. This extended timeframe shows a real, hard-fought battle, not a fleeting skirmish.
Why Volume Is the Ultimate Confirmation
If the price action is the story, then volume is the narrator telling you if the story is true. For a triple bottom, paying attention to volume is non-negotiable; it’s what separates A+ setups from ones that are likely to fail.
Look for a specific volume signature. As the pattern develops from the first trough to the third, trading volume should generally get lighter. Lower volume on the second and third lows suggests that the selling pressure is drying up. Fewer and fewer participants are willing to unload their shares at that support price.
Then, for the grand finale, you need to see a dramatic spike in volume as the price breaks out above the resistance level (the "neckline" connecting the peaks between the troughs). This surge of activity is your confirmation. It’s the market screaming that buyers have taken charge, with a flood of new money entering the stock and confirming the new uptrend. A breakout without this volume spike is suspicious and has a much higher chance of failing.
How to Trade the Triple Bottom Pattern

Spotting a clean triple bottom on a chart is a great start, but that's just the observation. Turning that observation into a profitable trade is what separates the pros from the crowd. This requires a solid, repeatable game plan.
A structured approach is your best defense against emotional decisions. When the market gets choppy, you won't be guessing; you'll be executing a plan you laid out when you were thinking clearly. Let's break down how to build one.
Pinpointing Your Entry
After the stock forms its third low and starts to head back up, all eyes turn to the neckline—that resistance level formed by the two peaks between the troughs. A break above this line is your green light, but there are a couple of ways to act on it.
1. The Aggressive Breakout Entry
This strategy is all about getting in on the action early. As soon as the price pushes decisively through the neckline, you open a long position to catch the initial burst of momentum.
- Trigger: You’re looking for a candle to close firmly above the neckline, ideally with a surge in volume. A simple touch or a quick poke through doesn't count. A confirmed close helps you sidestep frustrating "bull traps."
- Best For: Traders who are comfortable with a bit more risk and want to be positioned for the entire move up.
2. The Conservative Retest Entry
Patience is the name of the game here. Instead of buying the initial breakout, you wait for the price to pull back and "retest" the old neckline, which should now serve as a new floor of support.
- Trigger: The price breaks out, drifts back down to the neckline, and then bounces. Look for signs of strength on the bounce, like a bullish candlestick, to confirm support is holding.
- Best For: More risk-averse traders who value confirmation over being first. This often gives you a better entry price and a clearer sign that the breakout is for real.
A "throwback," where the price retests the breakout level, happens in about 65% of triple bottom patterns. Waiting for it can seriously improve your trade's risk-to-reward setup, but you have to accept that you'll occasionally miss the trade if the stock just takes off and never looks back.
Managing Your Risk with Stop-Loss Orders
Let’s be clear: no chart pattern works every single time. That's why your stop-loss order is the most important part of the trade. It’s your pre-defined exit plan if the pattern fails, protecting your capital from a significant loss.
Here are the two most logical places to set your stop-loss for a triple bottom:
- Below the Third Trough: This is the safest spot, giving the trade the most breathing room. You place your stop just below the lowest low of the entire pattern. If the price drops that far, the reversal signal is clearly invalid.
- Below the Neckline: This is a tighter, more aggressive placement. After the price breaks out, a drop back below the neckline is a strong signal that the breakout has failed. This stop is best used with a retest entry.
Your choice really depends on your entry and your personal risk tolerance. An aggressive breakout entry might call for the wider stop, while the conservative retest entry often allows for a much tighter one.
Setting Logical Profit Targets
The final step is knowing where to cash in. While you can always trail your stop-loss up, having a clear initial target helps you define your trade from the start. The classic method is to use the height of the pattern itself.
- Measure the Height: Calculate the price distance between the support level (the bottom of the troughs) and the resistance level (the neckline).
- Project Upward: Take that measured height and add it to the neckline breakout price. This gives you your minimum price target.
For example, if the lows are at $90 and the neckline is at $100, the pattern's height is $10. Your initial profit target would then be $110 ($100 breakout + $10 height). This simple calculation gives you a concrete goal and helps you ensure the potential reward is worth the risk you’re taking.
Real-World Examples of Triple Bottoms in Action

It's one thing to see a clean diagram in a trading book, but it’s another to see a triple bottom pattern form on a live chart. The real world is messy. These patterns are the result of genuine fear, indecision, and ultimately, a powerful shift in market psychology. Walking through historical examples is the best way to bridge the gap between theory and the split-second decisions of trading.
By looking at how these setups played out on major stocks, you start to get a real feel for their potential to signal massive trend reversals. These examples show us the whole story—from the preceding downtrend to the explosive move that can follow a confirmed breakout.
Apple Inc. (AAPL): The 2016 Turnaround
A perfect, almost legendary, example of a triple bottom showed up on the Apple Inc. (AAPL) chart back in 2016. The mood around the company was grim. Wall Street was buzzing with anxiety over slowing iPhone sales, and the narrative was that Apple's golden age of growth was over. That kind of negativity pushed the stock into a serious downtrend.
But then something interesting happened. Between February and June of 2016, sellers tried three separate times to push the stock below $90 per share, and each time, they failed. You could almost feel the battle lines being drawn. Despite the bad news, a huge number of investors clearly believed the stock was a bargain at that price, and they weren't letting it drop any further.
After that third failed attempt, the sellers were clearly exhausted. The stock began to climb, and once it broke above the neckline, it was off to the races. Buyers had taken full control, kicking off a powerful, multi-year rally.
This particular setup became a case study for a reason. After carving out those three lows near $90 over five months, the stock shot up 250% to hit $225 by mid-2018. It’s a stunning example of the pattern’s power. In fact, robust backtesting shows that triple bottoms, when confirmed with the right volume signals, have an average price target hit rate of 78%. Considering this pattern shows up in less than 5% of downtrends, its rarity is precisely what makes it such a high-conviction signal. For a deeper dive into the numbers, you can explore detailed analysis on the triple bottom pattern.
Anatomy of a Real-World Breakout
The Apple example is so great because it has all the classic ingredients of a high-quality setup. Let’s break down exactly what made it picture-perfect.
- A Clear Prior Downtrend: The pattern didn’t appear out of nowhere; it formed after a sustained sell-off, which is exactly what you want to see before a reversal.
- Three Defined Troughs: The three lows at the $90 support level were clean and obvious. It was a clear line in the sand.
- Waning Seller Volume: On the second and third tests of that $90 level, trading volume was noticeably lower. This was a huge clue that sellers were running out of steam.
- Neckline Break with Volume Surge: The moment the price broke through the neckline resistance, volume exploded. This confirmed that buyers were stepping in with conviction.
- Market Context: The pattern took shape at a time of peak pessimism. That’s often where the most durable market bottoms are made.
This real-world example underscores a crucial point: the most powerful chart patterns often form when market sentiment is at its worst. The triple bottom captures the exact moment that fear gives way to opportunity.
By studying reversals like Apple's in 2016, you start to build a mental library of what a good setup looks like. It’s not just about memorizing a shape on a chart. It’s about learning to read the story of supply and demand that the price action is telling you. That’s the understanding that gives you the confidence to act when a similar opportunity starts forming on your own screens.
Common Mistakes That Can Wreck This Trade
Even a setup as powerful as the triple bottom isn't a license to print money. It’s a high-probability signal, sure, but plenty of traders stumble over a few common—and costly—hurdles. Knowing what these pitfalls look like is just as vital as spotting the pattern in the first place. This is about sidestepping the traps and keeping your capital safe.
The number one mistake? Jumping the gun on the breakout. I see it all the time. A trader, buzzing with anticipation, dives in the second the price simply touches the neckline. That’s a rookie move. A real breakout needs confirmation, which means you have to patiently wait for a candle to close decisively above that neckline. A quick spike that gets smacked back down before the close is often just a bull trap, designed to sucker in the impatient money.
Mistaking a Choppy Range for a Reversal
Here's another classic error: seeing a triple bottom in what is really just a boring, sideways trading range. For a triple bottom to have any meaning, it absolutely must come after a prolonged downtrend. If a stock is just bouncing between two levels in a directionless market, it's missing the most important piece of the story: exhausted sellers.
Without that big drop first, the pattern has no reversal power. Think of it this way: a triple bottom is the grand finale of a bearish story, not just a random event in a go-nowhere plot. Always zoom out on your chart. If you don't see that preceding downtrend, the pattern isn't valid. Move on.
The triple bottom is a higher-conviction signal than its cousin, the double bottom, precisely because it shows a third failed attempt by sellers. This extra test of support adds a layer of validation, demonstrating that buyer resolve is strong and deeply entrenched.
Ignoring the Volume Story
Trading price without looking at volume is like trying to watch a movie with the sound off. The price chart tells you what happened, but the volume bars tell you how much conviction was behind the move. A high-quality triple bottom has a very distinct volume signature you need to see.
-
Drying Up Volume: As the three lows form, you want to see volume tapering off. This is a tell-tale sign that the sellers are getting tired and losing interest.
-
A Surge on the Breakout: When the price finally punches through the neckline, volume must explode higher. This is your confirmation that the big buyers have arrived and are taking control.
A breakout on wimpy, anemic volume is a massive red flag. It tells you the move lacks institutional support and is far more likely to roll over and fail.
The Reality of False Breakouts
False breakouts are a frustrating reality for every pattern trader, but a little statistical insight can help you manage them. The key is being disciplined about your chosen timeframe.
For example, a 2026 study of 1,500 NYSE setups found that the risk of a false breakout was dramatically lower on longer-term charts. It clocked the risk at just 15% on weekly charts, a far cry from the 35% risk on daily charts. Patience clearly pays. Furthermore, backtests on S&P 500 stocks from 1990-2020 show that properly confirmed triple bottoms led to average gains of 28% within 90 days, a full 12% more than the average double bottom. You can read more about these triple bottom pattern findings to see how data backs up this disciplined approach.
By sidestepping these common errors—waiting for a confirmed close, making sure there's a prior downtrend, and insisting on volume confirmation—you tilt the odds firmly in your favor. This is how you go from just seeing shapes on a chart to being a discerning analyst who trades with a clear, evidence-based edge.
Practice Trading Triple Bottoms Risk-Free
Knowing what a triple bottom looks like on a chart is one thing. Having the confidence to actually trade it is another entirely. This is where the real work begins—moving from theory to practice, and building the discipline you need to act decisively in the live market without risking a single dollar.
Think of it like a pilot in a flight simulator. You need to log hours to internalize the rules and build the muscle memory for your trading plan. This kind of practice lets you drill the mechanics of entry, exit, and risk management until they become second nature, long before your own capital is on the line.
From Scanning to Simulating
Let's be honest: one of the biggest hurdles for any trader is just finding good setups. Sifting through hundreds of charts every day is a surefire way to burn out. We take that grind off your plate. Our curated weekly chart lists at Channeling Stocks spotlight promising candidates, giving you a huge head start.
Once you’ve got a potential triple bottom in your crosshairs, it's time for rehearsal. Our platform is built for this exact moment, letting you trade the setup in a realistic simulation.
This is your sandbox to get your hands dirty and apply what you've learned:
- Nail the Breakout: Practice spotting the exact moment the price pierces and closes above the neckline.
- Set Your Orders: Go through the motions of placing your entry, your protective stop-loss below the lows, and your profit target.
- Manage the Trade: Watch how the trade develops and see if you can manage it by the book, without emotion getting in the way.
The point of practice trading isn’t to rack up a perfect "win" record. The real goal is to execute your plan flawlessly—to manage risk perfectly and follow your rules every single time. That’s how you forge a real edge.
Our tools are designed to move you from just understanding a concept to possessing a skill. By using our chart lists to find setups and our simulator to trade them, you turn abstract ideas into a repeatable process. You can learn more about how to sharpen your skills in our dedicated practice trading area.
At the end of the day, consistent, realistic practice is what separates someone who can analyze a chart from a trader who can profit from it. It's your space to make mistakes, learn the lessons, and build the kind of unshakeable discipline that trading successfully demands.
Your Triple Bottom Questions, Answered
Alright, you've got the anatomy of the triple bottom down. But when you're staring at a live chart, practical questions always come up. Let's walk through some of the most common ones traders ask to help you move from theory to confident execution.
Is a Triple Bottom More Reliable Than a Double Bottom?
Yes, it generally is, and the reason comes down to pure market psychology.
Think of it like this: a double bottom shows that sellers tried to push the price below a key support level and failed twice. That’s a significant event. But a triple bottom shows they failed a third time. This third failure is a much more powerful sign of seller exhaustion.
It proves that the buyers at that price level aren't just hanging around; they are dug in and defending their territory. While you'll definitely see more double bottoms in the market, the sheer rarity and structure of a true triple bottom give it a higher statistical reliability when it finally breaks out.
What Is the Best Timeframe for Trading This Pattern?
For the most reliable signals, you'll want to hunt for triple bottoms on longer timeframes, like the daily and weekly charts.
This pattern represents a major, long-term tug-of-war between buyers and sellers, often taking 3 to 6 months to fully play out. A battle that long carries far more weight on a higher timeframe.
Can you find them on intraday charts, like a 15-minute or 1-hour? Sure, but they're often less reliable and can turn out to be simple market noise rather than a genuine reversal. One study of 1,500 setups on the NYSE showed the risk of a false breakout was only 15% on weekly charts, but that number jumped to a much riskier 35% on daily charts. The longer the timeframe, the more significant the story the chart is telling.
How Can I Tell if a Triple Bottom Is About to Fail?
A failing triple bottom will usually give you a couple of clear warning signs. The biggest red flag is obvious: a decisive break below the support level defined by the three lows. If the price closes firmly below that floor, the bullish case is dead, and you can expect the old downtrend to come roaring back.
The other major tell is a breakout that just doesn't have any gas in the tank. A real reversal needs commitment.
If the price nudges above the neckline but trading volume is anemic or even declining, it’s a huge warning that the move lacks conviction. These low-volume breakouts are notorious for sucking traders in and then collapsing, creating a classic bull trap.
How Often Does This Pattern Actually Work?
The triple bottom is known as one of the more dependable reversal patterns for a reason. While nothing in trading is a sure thing, years of research give us a great idea of its historical performance.
Data from respected technical analysts like Thomas Bulkowski, who has performed some of the most extensive backtesting on chart patterns, gives us a solid baseline:
- The pattern successfully breaks out and hits its measured price target between 74% and 79% of the time.
- The odds of the price pulling back to retest the old breakout level (what we call a "throwback") are quite high, happening about 65% of the time. This can be a gift, offering a second chance to enter for traders who missed the initial move.
When you find a clean triple bottom and get that all-important volume confirmation, the odds are stacked in your favor.
Ready to move from theory to practice? Channeling Stocks provides curated weekly chart lists to help you spot potential triple bottoms and a full paper-trading environment to rehearse your strategy risk-free. Build the confidence and discipline you need to trade these powerful setups by visiting https://www.channelingstocks.com.