
Swing trading chart patterns are simply recurring shapes on a price chart that can hint at where a stock is headed next. Formed over several days or weeks, these patterns give us a visual snapshot of the battle between buyers and sellers, helping us spot potential continuation or reversal points in a trend.
Learning The Market's Visual Language

Trying to trade without understanding chart patterns is like reading a book with half the words blacked out. You might get the gist, but you’ll miss the full story. The market communicates visually, and swing trading chart patterns are its vocabulary—telling the ongoing tale of supply and demand.
These formations aren't some kind of magic. They are just the byproduct of human behavior, drawn out on a chart. Over days and weeks, the constant tug-of-war between bullish buyers and bearish sellers creates distinct, recognizable shapes. Learning to spot them is the first real step toward trading with a plan instead of just pure guesswork.
A Roadmap for Price Action
Think of a stock chart as a roadmap and the price as your car. Chart patterns act as the road signs, warning you of what might lie ahead. Is it a long, straight highway, suggesting a strong trend will continue? Or do you see a sharp curve or U-turn sign, hinting at a potential reversal?
This simple analogy cuts through a lot of the noise around technical analysis. At its core, that’s all we’re doing: reading the map.
For swing traders, these patterns are indispensable. We hold positions for days or even weeks, which gives these patterns enough time to fully form and provide much clearer signals than the minute-by-minute blips day traders chase. If you're just getting your feet wet, our guide on how to read stock charts for beginners is a great place to build that initial foundation.
At its heart, a chart pattern is a story about the balance—or imbalance—between buying and selling pressure. When you learn to read these stories, you gain a powerful edge by anticipating probable outcomes based on historical behavior.
Chart patterns generally fall into two main categories. Each tells you something different about the market's current mood and where it might go next. Knowing the difference is key to making sure your trades are aligned with the prevailing momentum.
To quickly summarize these two groups, here's a simple breakdown of what they are and what they signal.
Quick Guide To Pattern Types And Their Signals
| Pattern Category | What It Signals | Common Examples |
|---|---|---|
| Continuation | A temporary pause in an existing trend before the price continues in the same direction. | Flags, Pennants, Rectangles, Channels |
| Reversal | The current trend is losing steam and is likely to change direction. | Head & Shoulders, Double Tops/Bottoms |
Understanding these signals helps you distinguish a minor pullback from a major trend change.
Learning to identify these key formations helps you stop reacting to market noise and start acting on high-probability setups. This section will give you the tools to see the market not as a series of random ticks, but as a structured story you can learn to read.
Alright, let's move from the theoretical side of things and get practical. It's time to open up the trading toolkit and look at the seven essential patterns that every serious swing trader needs to know inside and out. These aren't just random squiggles on a screen; each one tells a story about market psychology and gives you a powerful clue about where the price might be heading next.
Learning to spot these core swing trading chart patterns is a fundamental skill. When you understand the narrative behind each formation—the constant tug-of-war between buyers and sellers—you start anticipating market moves instead of just reacting to them.
Let's break down these powerful setups one by one.
1. Channels: The Trader's Roadmap
Channels are one of the most reliable and frequently seen patterns in the market. Picture a stock's price flowing down a river, bouncing between two parallel banks. The upper bank is your resistance (the ceiling), and the lower bank is your support (the floor).
For a swing trader, a clean channel is a beautiful thing. The game plan is wonderfully simple:
- Look to buy when the price taps the lower support trendline.
- Look to sell or take profits when it nears the upper resistance trendline.
A channel shows you an orderly, established trend. As long as the price continues to respect these boundaries, you've got a repeatable, high-probability environment to trade in. It’s this predictability that makes services like Channeling Stocks so effective—they do the heavy lifting to find stocks moving in these clear, tradable corridors.
2. Flags And Pennants: The Brief Pause
Flags and pennants are quick continuation patterns. They show up when a stock makes a powerful, explosive move and then needs to take a quick breather before continuing in the same direction. Think of a sprinter catching their breath for a few seconds before the next dash.
- Flags look like a small, slanted rectangle that leans against the direction of the main trend.
- Pennants appear as a small, tight triangle after a very sharp move up or down.
The strong initial move is what we call the "flagpole." Following this surge, you'll typically see volume dry up as the market consolidates into the flag or pennant shape. The signal to get ready is the breakout—when the price pushes out of this little consolidation on a fresh wave of volume, it’s a sign the original trend is back on.
3. Triangles: The Coiling Spring
Triangles are fascinating patterns. They signal that a major battle between buyers and sellers is coming to a head. You'll see the price action get squeezed into an ever-tighter range, like a spring being compressed before it inevitably pops.
You'll encounter three main types:
- Ascending Triangles: These have a flat top (resistance) with a rising bottom trendline (support). This is a bullish setup, telling you buyers are getting more aggressive and an upside breakout is the most likely outcome.
- Descending Triangles: The opposite, with a falling top trendline (resistance) and a flat bottom (support). This is bearish, showing sellers are gaining the upper hand and a breakdown is probably on the horizon.
- Symmetrical Triangles: Here, both trendlines are converging toward each other. This is a neutral pattern; the market hasn't decided which way to go. Traders simply wait for a confirmed breakout in either direction before making a move.
As the triangle forms, volume tends to shrink. Then, on the breakout, you want to see a big spike in volume to confirm that the move is for real.
Triangles are a visual representation of market indecision contracting into a point of decision. The subsequent breakout often releases significant pent-up energy, resulting in a powerful move.
4. Double Tops And Bottoms: The Trend Reversal Signal
Double tops and bottoms are some of the most powerful reversal patterns you'll find. They tell you that a trend has tried to continue, failed, and is now very likely to head in the opposite direction.
A Double Top forms a clear "M" shape. The price hits a high, pulls back, tries to take out that high again, but can't. That failure to push higher is a huge red flag that buyers are exhausted. When the price then breaks the support level between the two peaks (the "neckline"), it often signals the start of a new downtrend.
A Double Bottom, on the other hand, looks like a "W." The price hits a low, bounces, and then successfully retests that low without going lower. This shows sellers have run out of steam and buyers are stepping in. A break above the resistance neckline between the two lows can kick off a brand-new uptrend.
5. The Head And Shoulders Pattern: The Classic Reversal
This is one of the most famous and reliable reversal patterns in all of technical analysis. When you see a clean one, you pay attention.
The standard Head and Shoulders is a bearish pattern marking the potential end of an uptrend. It’s formed by three successive peaks:
- A left shoulder (a peak).
- A head (a higher peak).
- A right shoulder (a final, lower peak, roughly the same height as the left).
A line connecting the lows between these peaks forms the "neckline." Once the price falls and closes below this neckline after forming the right shoulder, the reversal is confirmed, and lower prices are expected. The bullish version, the Inverse Head and Shoulders, is simply flipped upside down and signals a bottom is in place.
6. Rectangles: The Trading Range
A rectangle, or a "trading range," is what you get when a stock’s price gets stuck moving sideways between clear horizontal support and resistance levels. It’s a visual sign of a temporary stalemate where neither buyers nor sellers have the upper hand.
As a swing trader, you have two ways to play a rectangle:
- Trade the range: You can buy near the support level and sell near the resistance level, bouncing back and forth until the pattern breaks.
- Trade the breakout: A more common approach is to wait patiently for the price to decisively break either above resistance or below support, and then trade in the direction of that breakout.
A big increase in volume on the breakout is what you want to see for confirmation. Without it, the move might be a fake-out.
7. Cup and Handle: A Bullish Continuation
The Cup and Handle is a classic bullish pattern that signals a period of consolidation is ending and an upward move is about to resume. It looks exactly like its name: a rounded "cup" bottom, followed by a short, downward-drifting "handle."
The "U" shape of the cup is important—it shows a gradual, stable basing process, which is much stronger than a sharp "V" bottom. The handle is just a final, small pullback before the stock attempts to break out above the resistance level formed by the rim of the cup. For a more detailed walkthrough, our post on how to identify and trade Cup and Handle patterns covers this setup from start to finish.
Getting comfortable spotting these seven patterns is the foundation of good chart analysis. The key is simply practice—looking at hundreds of charts until recognizing them becomes second nature.
How To Confirm A Pattern Before You Trade
So you’ve spotted what looks like a textbook bull flag or a perfect head and shoulders pattern. Great! But hold on a second before you hit that buy button.
Seeing a pattern form is just the first part of the job. The real skill—the one that separates traders who make a living from this and those who are just feeding the market—is knowing how to tell a genuine setup from random market noise. A raw pattern is a gamble; a confirmed pattern is a high-probability trade.
Think of it like this: A single clue at a crime scene is interesting, but it doesn’t solve the case. You need multiple pieces of evidence all pointing to the same conclusion. That's exactly what we need to do with our charts.
Use Multiple Timeframes for a Clearer Picture
The single best way to get this confirmation is through multi-timeframe analysis. Sticking to just one chart is like trying to navigate a city by only looking at the street right in front of you. You have no idea if you're heading toward a dead-end or onto a highway. Pros zoom out to see the whole map.
Most experienced swing traders use a simple three-tiered approach to get the full story.
Here's a quick look at the main types of swing trading chart patterns you'll be hunting for.
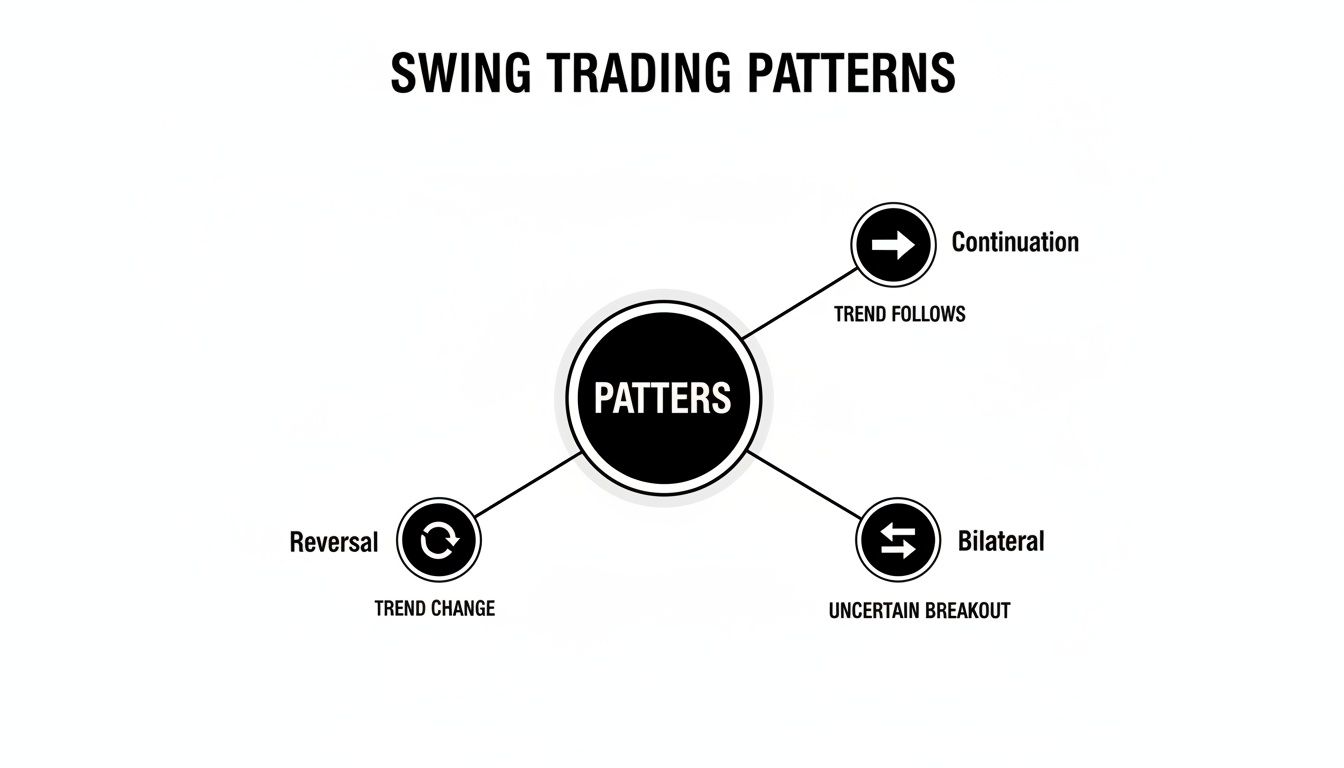
Knowing if you're looking at a potential continuation or a reversal is crucial, and the three-timeframe method gives you the context to trade them with confidence.
Here’s how that framework looks in practice:
- The Weekly Chart (The "Macro" Trend): Always start here. This is your 30,000-foot view. Is the stock in a major uptrend, downtrend, or just chopping sideways? Trading with this primary trend is the easiest way to put the odds on your side.
- The Daily Chart (The "Setup" Chart): This is where you'll do most of your hunting for the patterns themselves—the channels, flags, and triangles. The daily chart is the sweet spot for swing traders because it filters out the distracting noise of intraday price swings.
- The 4-Hour Chart (The "Entry" Trigger): Once you've found a promising pattern on the daily chart that agrees with the weekly trend, you zoom in one last time. The 4-hour chart helps you nail your entry, letting you spot a precise breakout or a successful retest of a key level.
Aligning your trade across these three timeframes ensures you aren't trying to swim against a powerful current. You're confirming that the short-term setup is supported by the larger market structure.
This isn't just theory, either. Studies have shown that traders who properly align timeframes can see 40-50% better risk-adjusted returns. It's a disciplined approach that takes the guesswork out of the equation. If you want to dig deeper, check out these insights on swing trading patterns and timeframe analysis.
Let Volume Be Your Lie Detector
After getting your timeframes in sync, trading volume is the next critical piece of evidence. Think of volume as a lie detector for the market; it tells you how much conviction is behind a price move.
A breakout that happens on weak, anemic volume is incredibly suspicious. More often than not, it's a "fakeout" designed to trap eager traders before the price snaps back in the other direction.
What you want to see is a breakout powered by a huge surge in volume. That tells you the big players—the institutions—are getting involved and are validating the move. That’s the kind of confirmation you can trade on.
Here’s the simple two-step check:
- Contraction During the Pattern: While a pattern like a pennant or triangle is forming, you should ideally see volume dry up. This coiling action shows the market is building up energy for its next big move.
- Expansion on the Breakout: The moment the price breaks out, volume must come rushing in. Look for a spike that's at least 50% above its recent average. This is the fuel that will propel the new trend.
No single tool is a magic bullet, but combining multi-timeframe alignment with a decisive volume surge is a powerful one-two punch. It dramatically tilts the odds in your favor and turns a simple shape on a chart into a trade you can take with real confidence.
From Analysis to Action: Your Rules-Based Trading Playbook
You've done the hard work. You've spotted a classic swing trading chart pattern, confirmed it across multiple timeframes, and seen that tell-tale surge in volume. The setup looks perfect. Now what?
This is the moment where most traders stumble. Hesitation, greed, and fear creep in, turning a high-probability setup into a costly mistake. To sidestep this emotional trap, you need a pre-defined playbook for every trade—a set of crystal-clear rules that dictate your every move, from entry to exit.
This isn't about trading on a hunch. It's about having a mechanical, repeatable system that keeps you disciplined when the market gets chaotic. Let's build that system.
Pinpointing Your Entry Trigger
The first rule in your playbook is knowing exactly what gets you into a trade. A fuzzy idea like "I'll buy on the breakout" is a recipe for disaster. You need a specific, non-negotiable trigger—an event on the chart that tells you, "It's go time."
Waiting for a clear trigger stops you from jumping the gun, which is one of the easiest ways to get shaken out of a good trade by normal market noise.
Here are a few simple but effective entry triggers you can adopt:
- The Breakout Entry: This is the most straightforward. You enter only after a candle closes above a key resistance level (for a long trade) or below support (for a short trade). Waiting for the close confirms the breakout has some real conviction behind it.
- The Retest Entry: This is a more patient, and often more profitable, approach. After the price breaks out, you wait for it to pull back and touch the level it just broke. If it bounces off this old resistance-turned-new-support, you enter. Your entry price is better, and your risk is often smaller.
- The Trendline Cross: Perfect for channels or flag patterns. The trigger is a decisive move and close across the trendline that has been boxing in the price.
Pick one, define it, and stick to it. This single piece of discipline will filter out countless weak setups and bring consistency to your execution.
Defining Your Exit Strategy Before You Enter
Great trading has less to do with being right and more to do with how you manage being wrong. Before you risk a single dollar, you must know two things: your escape point if the trade goes sour and your target for taking profits. Deciding these on the fly is a classic rookie error.
A professional trader enters every position with a pre-defined exit plan. They know their maximum acceptable loss and their realistic profit objective before they click "buy."
This plan has two non-negotiable parts: your stop-loss and your profit target.
1. The Stop-Loss Order: Your Capital’s Shield
Think of your stop-loss as your eject button. It's an order that automatically closes your position if the price moves against you to a pre-set level. It's the most crucial risk management tool you have.
But where you place it isn't random. A good stop-loss should be based on the pattern's own structure.
A simple rule to live by:
- Place your stop-loss at a price that would invalidate the entire pattern.
- For a bullish breakout from an ascending triangle, a logical spot is just below the most recent swing low within the pattern. If the price drops that far, the breakout has clearly failed.
- For a bearish Head and Shoulders pattern, the stop would go just above the peak of the right shoulder.
This logical placement means you're only stopped out when the reason for the trade is gone, not by random market wiggles.
2. The Profit Target: Knowing When to Cash In
Cutting losses is vital, but so is locking in profits. A powerful way to set objective targets is the "measured move" technique. It uses the pattern's size to project a realistic price target.
For example, if you're trading a rectangle pattern, you simply measure the height of the rectangle (the distance from its support to its resistance). You then add that distance to the breakout price. This gives you a data-driven target and helps you fight the urge to get greedy and watch a winning trade turn into a loser.
Building Confidence With Backtesting And Paper Trading
Spotting a perfect swing trading chart pattern on a chart feels great. But having the guts to actually put your hard-earned money on the line? That's a completely different ballgame. You wouldn’t try to fly a 747 without logging serious hours in a simulator, and you shouldn't risk real capital without first proving your strategy works.
This is exactly why backtesting and paper trading are non-negotiable. They are the essential link between knowing the theory and executing trades in the real world, allowing you to build genuine skill without risking a single dollar. Consider it your trading apprenticeship.
The Power of Backtesting Your Patterns
Backtesting is how you prove to yourself that a pattern has a statistical edge. It’s a simple, manual process: you just scroll back in time on a stock's chart and analyze how a specific setup performed historically. You're not just hunting for wins; you're gathering cold, hard data.
For instance, you might go back a year on a chart and log every single bull flag pattern you can find. The goal is to get answers to some critical questions:
- What was the real-world win rate for this setup?
- How often did the price actually hit the "measured move" target?
- What percentage of the time did the breakout simply fail and reverse?
This process transforms your approach from one of hope to one based on probability. It shows you which swing trading chart patterns are worth your time and helps you sharpen your rules based on what has actually happened in the past, not just what a textbook says should happen.
Backtesting is about replacing fear and hope with data and evidence. It’s how you build the deep conviction needed to follow your trading plan, even when emotions run high.
From Practice to Performance With Paper Trading
After your backtesting shows that a pattern is reliable, it's time to practice executing in a live market. Paper trading lets you do just that—placing trades based on your rules in real-time, but with "fake" money. This is where you put all the pieces together.
Here’s a straightforward way to get started:
- Define Your Setup: Pick one or two patterns you've backtested and know well, like channels or ascending triangles.
- Execute Based on Rules: Follow your entry, stop-loss, and profit-taking rules to the letter. No exceptions. Did the breakout candle close strong? Was there a spike in volume?
- Track Every Trade: Keep a simple journal. Note the pattern, your entry and exit prices, and the outcome. Crucially, jot down why you took the trade and whether you stuck to your plan.
This isn't just a numbers game. It's about building the muscle memory and discipline required for successful trading. You’ll get faster at pattern recognition, become comfortable placing orders on your platform, and learn to manage a trade without the emotional rollercoaster that comes with using real money.
To see these principles in action, check out these paper trading examples for practical walkthroughs and to gain more experience.
Finding High-Probability Setups With Curated Research
If you've ever spent hours flipping through charts, you know the feeling. You're hunting for that perfect setup, but all you find is messy, unpredictable price action. It's a grind, and frankly, it's a fast track to trader burnout.
This endless, manual scanning is a huge time-sink, especially if you're trading alongside a day job. But what if you could skip the needle-in-a-haystack search and get right to the good stuff? That's exactly what smart, time-crunched traders do. They use curated research.
Think of it as having a team of analysts do the initial legwork for you, flagging stocks that are already forming promising swing trading chart patterns.
Work Smarter, Not Harder
Instead of starting from scratch every morning, you begin your day with a pre-vetted list of potential trades. A service like Channeling Stocks, for example, gives you a weekly list of stocks already moving in clear, defined channels. Right away, you have a focused watchlist with obvious support and resistance levels.
This simple shift changes your entire workflow. You stop wasting energy on the search and pour your valuable time into what actually makes you a better trader:
- Confirming the pattern is holding up on different timeframes.
- Looking for a spike in volume to validate the move.
- Pinpointing your exact entry, stop-loss, and profit targets.
By working with a smaller, higher-quality list of candidates, you're not just saving time. You're accelerating your learning curve and building the confidence to act decisively.
There's a reason this works. The underlying principle has been proven over decades of market analysis.
Traditional chart patterns have demonstrated a strong historical track record in technical analysis, with their effectiveness rooted in the predictable behavior of market participants responding to news and events.
This isn't some niche strategy; it’s a core component of market analysis. It's estimated that 60-70% of professional traders rely on pattern recognition to inform their trades, a powerful testament to its value. You can discover more insights about traditional chart patterns and their role in modern trading to see why it remains so prevalent.
At the end of the day, using curated research is about protecting your most valuable resource—your time. It lets you stop being a "stock finder" and start being a trader who executes a plan on high-probability setups. That efficiency is the key to building the consistency needed for long-term success.
Frequently Asked Questions About Chart Patterns
Once you start digging into the world of swing trading chart patterns, the real-world questions inevitably start to pop up. It's one thing to see them in a textbook, but it's another to risk real money on them.
This section tackles the practical questions I hear most often from traders who are just starting out. Let's clear up the common points of confusion so you can trade with more confidence.
How Reliable Are Swing Trading Chart Patterns?
Let's get one thing straight: no chart pattern works 100% of the time. If anyone tells you they have a foolproof signal, you should be skeptical. The real value of a pattern isn't in predicting the future; it's in stacking the odds in your favor. Think of them as high-probability setups, not guarantees.
A pattern's reliability skyrockets when you look for confirmation. A breakout without a big spike in volume is suspect. A beautiful flag pattern that's pushing up against a major weekly resistance level is a trap. A pattern is just one piece of evidence, not the entire case. It has to fit within your larger trading plan, which always includes strict risk management.
What Is The Best Timeframe For Swing Trading Patterns?
For most swing traders, the daily chart is home base. It’s the sweet spot, giving you a clear view of significant price moves without all the noise and fake-outs you see on shorter timeframes. But the best traders never look at just one chart in isolation.
They use a multi-timeframe approach to get the full story:
- The Weekly Chart: This is for the 30,000-foot view. Is the stock in a major uptrend, downtrend, or just chopping sideways? You want to be trading in the direction of this primary current.
- The Daily Chart: This is where you'll spot the main pattern setting up—your channel, triangle, or flag.
- The 4-Hour Chart: Once your daily pattern is close to a trigger point, you zoom in here to pinpoint your exact entry and place a tight stop-loss.
This method keeps you from making a classic mistake: taking a perfectly good-looking daily setup that's actually just a minor pullback in a much larger weekly downtrend.
A pattern on the daily chart might look like a great trade, but if the weekly chart shows it's running directly into major resistance, you've just uncovered a critical piece of information that could save you from a losing trade.
Can I Use These Patterns For Any Stock Or Market?
Absolutely. The beauty of chart patterns is that they're fractal—they show up on every timeframe and in every liquid market. You'll find channels, triangles, and head & shoulders patterns in stocks, ETFs, forex, and crypto. Why? Because they are visual representations of human psychology, and fear and greed work the same everywhere.
The key word, however, is liquid. These patterns are far more reliable on stocks and assets with high trading volume. Lots of volume means the pattern is being created by a true consensus of thousands of buyers and sellers. On a thin, illiquid stock, a single large order can create a misleading pattern, and that's a game you don't want to play.
How Many Patterns Should I Learn To Master?
This is where most new traders get it wrong. They try to learn a dozen different patterns at once and end up not really knowing any of them. The truth is, most professional traders I know are specialists. They've built their careers by mastering just two or three patterns.
Focus on depth over breadth. Pick a couple of patterns that make intuitive sense to you—maybe Channels and Triangles—and learn them inside and out. Understand the psychology behind them, the common failure points, and the precise conditions that make them work. Knowing a few patterns like the back of your hand is infinitely more profitable than having a passing familiarity with twenty.
Instead of spending all your time hunting for the perfect setup, you could let Channeling Stocks do the heavy lifting. We curate lists of stocks that are already forming clean, actionable channels, letting you focus on the most important part: your analysis and execution. Find your next high-probability setup at Channeling Stocks.