
Momentum day trading is, at its heart, a simple idea: find a stock that's moving with force and ride the wave. It’s all about capitalizing on short-term, explosive price swings fueled by a surge of buying or selling. This isn't about long-term investing or predicting where a stock will be next year. It's about what's happening right now.
The Real Principles of Momentum Day Trading
Let's cut through the noise of complex indicators and abstract theories. True momentum trading is about identifying stocks that are clearly "in play" and having the discipline to act on what you see in the price and volume. It’s a game of speed, precision, and a gut-level feel for market psychology.
You’re not trying to be a fortune teller. Instead, your job is to react decisively to imbalances between supply and demand as they happen. These imbalances are what create the powerful, fast-moving trends we're looking to trade.
Understanding the Core Concepts
Before you even think about placing a trade, you need to internalize a few foundational ideas. These are the mental filters you’ll use to separate a high-probability setup from a costly trap.
To really nail this down, it helps to see the core ideas laid out clearly.
Key Momentum Concepts You Need to Know
This table breaks down the essentials. Think of these as the non-negotiable building blocks of any successful momentum trade.
| Concept | What It Is | Why It Matters for Your Trades |
|---|---|---|
| Stocks in Play | Stocks with unusually high trading volume and volatility, typically sparked by a news catalyst. | These are the only stocks that have enough interest and order flow to support a strong, sustained momentum move. |
| Volume | The number of shares traded. It’s the fuel that drives price movement. | A price move on low volume is weak and unreliable. A price surge with massive volume shows real conviction and power. |
| Price Action | The pure movement of a stock's price on a chart, revealing patterns of buying and selling pressure. | It’s the unfiltered story of supply and demand. Learning to read it is more important than any lagging indicator. |
Grasping these three concepts is the first step toward developing a trader's intuition. They help you focus on what truly matters in the heat of the moment.
This style of high-speed trading wasn't even possible for most retail traders until the late 1990s, when Electronic Communication Networks (ECNs) gave us direct, lightning-fast access to the market. But that access came with a warning: a 2000 study showed that roughly 70% of day traders lost money. This highlights a crucial truth—success comes from discipline, not just from chasing fast stocks. For more on the history of these strategies, you can check out this detailed analysis of RSI momentum strategies.
The single most important skill is learning to read the tape—the flow of orders and volume. Price can lie, but volume rarely does. It shows you where the real money is flowing.
The Psychology of Momentum
Behind every chart pattern are real human emotions. The two most powerful forces driving momentum are the Fear of Missing Out (FOMO) and pure panic. When a stock breaks out, FOMO sucks in wave after wave of buyers, creating a self-feeding loop that pushes the price higher.
On the flip side, when that trend finally cracks, panic selling can trigger a sudden and brutal collapse. As a momentum trader, your goal is to ride that initial wave of greed and get out before the fear takes over. It's less about being smarter than everyone else and more about being more disciplined.
Building Your Pre-Market Watchlist

If you think momentum trading starts at 9:30 AM ET, you’re already behind. The real work—the part that actually makes you money—happens in the pre-market session. This is your window to cut through the noise and find the handful of stocks worth your attention.
The goal isn't to build a laundry list of tickers. It's to surgically identify the top 3-5 stocks with the highest odds of a clean, explosive move right out of the gate. This prep work is what separates the traders who are ready to act from those who spend their morning chasing whatever's hot.
Scanning for Pre-Market Movers
Your first tool is a pre-market scanner. Its job is simple: find stocks with unusual activity before the market opens. We're looking for stocks that are already showing signs of life and, more importantly, have serious money behind them.
To do this, you need to give your scanner some specific instructions. While my settings might differ slightly from another trader's, the underlying logic is always the same. We're hunting for abnormal volume and a significant price gap, usually tied to a news catalyst.
Here are the baseline settings I use to find momentum candidates:
- Price: I stick to stocks between $5 and $100. Anything cheaper tends to be too wild and unpredictable, while pricier stocks often lack the volatility needed for quick day trades.
- Pre-Market Volume: Set a minimum of 50,000 to 100,000 shares. This tells you there's real interest—not just a few random orders.
- Price Change: Look for stocks gapping up or down at least +2% or -2%. A gap this large is the first clue that a meaningful catalyst might be in play.
These are just the fundamentals. You can dig deeper into filtering strategies with our guide to the best stock screeners for swing trading, as many of the same principles apply.
A stock gapping up on 2,000 pre-market shares is noise. The same stock gapping up on 200,000 shares is a signal. Your scanner's job is to tell you the difference.
Vetting Your Scanner Results
Once your scanner spits out a list, the real analysis begins. Just because a stock meets your technical criteria doesn't mean it's a good trade. Now you have to play detective and figure out why it's moving. This means pulling up the headlines for every stock on your list.
You're searching for a powerful catalyst—a piece of news so significant it can alter a company's story for the day.
What makes a catalyst strong? Look for these:
- Earnings Reports: A huge beat or a dramatic miss on earnings will almost always create volatility.
- Clinical Trial Data: For biotech stocks, positive or negative results are everything.
- FDA Approvals: An FDA green light can send a pharmaceutical stock into the stratosphere.
- Mergers and Acquisitions: News of a buyout creates immediate and often predictable price action.
- Analyst Upgrades/Downgrades: A rating change from a well-respected firm can absolutely move the needle.
Just as important is learning what to ignore. If you see a stock up 15% on high volume but can't find a single piece of news, be very skeptical. It's likely a speculative pump that could collapse at any moment. Stick to stocks with a clear, verifiable story.
Drawing Pre-Market Levels
With your list narrowed down to the best 3-5 candidates, it's time for the final step: charting your battle plan. Before the bell rings, you need to mark the key price levels on your charts. These lines become your roadmap for the trading day, telling you where to consider entries, take profits, or cut losses.
Pull up a 1-minute or 5-minute chart for each stock and mark these non-negotiable levels:
- Pre-Market High: The absolute highest price the stock hit before 9:30 AM. This is your initial resistance level.
- Pre-Market Low: The lowest price it touched during the pre-market session. This acts as a critical support area.
- Key VWAP Levels: Keep an eye on the Volume-Weighted Average Price (VWAP). It often acts as a magnet for price and can serve as dynamic support or resistance.
By the time the market opens, you won't be scrambling to find a trade. You'll be calmly watching your hand-picked stocks, waiting for the price action to confirm your plan by interacting with the levels you've already identified. This preparation is the bedrock of a solid trading session.
Finding Your A-Game Trading Setups
You've done the pre-market homework and built a solid watchlist. Now comes the real work: patiently waiting for a high-probability setup to form. This is where the pros separate themselves from the crowd. We don't guess, and we don't chase. We have a playbook of patterns we know inside and out, and we only risk our capital when the odds are stacked in our favor.
I’m going to walk you through the anatomy of three of my go-to patterns: the Opening Range Breakout (ORB), the Bull Flag, and the Red-to-Green move. For each one, you need a non-negotiable checklist. If a stock doesn't tick every single box, you simply move on.
The Opening Range Breakout (ORB)
The market open is pure chaos, but within that chaos lies incredible opportunity. The first 30-60 minutes of the session often set the tone for the entire day, which is the perfect environment for the Opening Range Breakout (ORB). The idea is simple: let the stock establish a high and low early on, then trade the break of that range.
Most traders I know focus on the first 5, 15, or 30-minute ranges. A 5-minute ORB is fast and furious, great for catching explosive moves right out of the gate. A 30-minute ORB is more my speed; it's a more conservative play that confirms the trend has some real legs.
For an ORB to be worth my time, it absolutely must meet these criteria:
- A Clean Range: I need to see a very clear ceiling (resistance) and floor (support) form. If the price action is a choppy mess, I'm not interested.
- High Relative Volume: The breakout itself has to happen on a huge volume spike. I want to see the biggest volume bar of the day, confirming that big money is behind the move. A breakout on weak volume is a classic rookie trap.
- VWAP Confirmation: When going long, the price should be holding above the Volume-Weighted Average Price (VWAP). This tells me institutions are likely buyers, not sellers.
The Classic Bull Flag Pattern
Stocks don't go up in a straight line. After a powerful opening drive, they need to take a breather, consolidate, and build energy for the next push. This pause often creates a Bull Flag, one of the most reliable continuation patterns you'll ever find.
Think of it in two parts. The "flagpole" is the initial, sharp run-up on heavy volume. The "flag" is the important part: a tight, orderly pullback on much lighter volume. That low-volume drift is the key—it shows that sellers have no power and that buyers are just catching their breath before the next assault.
The trade is triggered when the price breaks above the top of that little flag channel, and you should see volume rushing back in. This is your signal that the uptrend is back on. You can set a tight stop loss just below the low of the flag, giving you a clearly defined, low-risk entry point. Our complete guide on support and resistance trading will give you a much deeper foundation for how these levels create the structure for patterns like flags.
Red-to-Green Moves
A Red-to-Green (R2G) move is a fantastic setup because it signals a major shift in market psychology. This happens when a stock that opened down for the day (in the red) claws its way back to cross above the previous day's closing price, turning it positive for the day (green).
That crossover from red to green is a massive psychological line in the sand. It pulls in a whole new wave of sidelined buyers who were waiting for proof of strength, and the result is often an explosive surge.
My ideal R2G candidate is a stock from my watchlist that had good news but got sold off at the open for some reason. As it starts to reclaim that prior day's close, I’m looking for two things to confirm the move:
- A Volume Surge: The exact moment it crosses from red to green needs to have a big pop in buying volume.
- Breaking Key Levels: The move is even stronger if it's also breaking through other resistance points at the same time, like the morning's high or the VWAP.
This convergence of signals is what makes the R2G so reliable. It tells you the morning sellers have been completely absorbed and the bulls are now in total control.
Don't just take my word for it on volume. One analysis of breakout patterns showed that when a stock broke resistance on volume that was 200% or more of its average, the move had a 72% chance of continuing higher. This is the kind of statistical edge we're looking for. You can dig into more data on the power of volume-confirmed momentum on Barchart.com.
By mastering the specific entry criteria for the ORB, Bull Flag, and Red-to-Green setups, you stop gambling and start trading with a methodical, repeatable process.
From Signal to Execution: Your Rules for Entry and Exit
Spotting a perfect setup on a chart is a great start, but it's only half the job. Without a rock-solid plan for how you'll get in and out of the trade, even the most promising patterns can fall apart. This is where discipline takes over from analysis.
A trade doesn't begin until a specific trigger occurs. This isn't about getting a "good feeling"—it's a concrete event you've been waiting for. For an Opening Range Breakout, that trigger is a high-volume candle closing firmly above the range high. For a Bull Flag, it's the price decisively cracking the upper trendline of that tight consolidation. Your only job is to wait for that signal and act without a moment of hesitation.
Here's a pro tip: to combat slippage (the gap between the price you want and the price you get), try using limit orders. Placing your order just a penny or two above the breakout spot can prevent you from chasing a stock that explodes upward, ensuring a more predictable entry.
Nail Down Your Risk Before You Enter
Before you even dream about profits, you have to define your pain point. Every single trade must have a pre-determined stop-loss. Think of it as your eject button. It's the non-negotiable price where you admit the trade idea was wrong and get out to protect your capital.
The right spot for your stop-loss depends entirely on the setup:
- Opening Range Breakout (ORB): Tuck your stop just below the midpoint of the opening range, or perhaps below the VWAP if it offers a stronger support level.
- Bull Flag: This is one of the cleanest. Place the stop just beneath the lowest candle in the flag pattern. The risk is incredibly well-defined.
- Red-to-Green Move: Your stop can go right below the previous day's closing price—the very level that created the setup in the first place.
Many of these patterns can flow into one another throughout the morning, creating a sequence of opportunities.
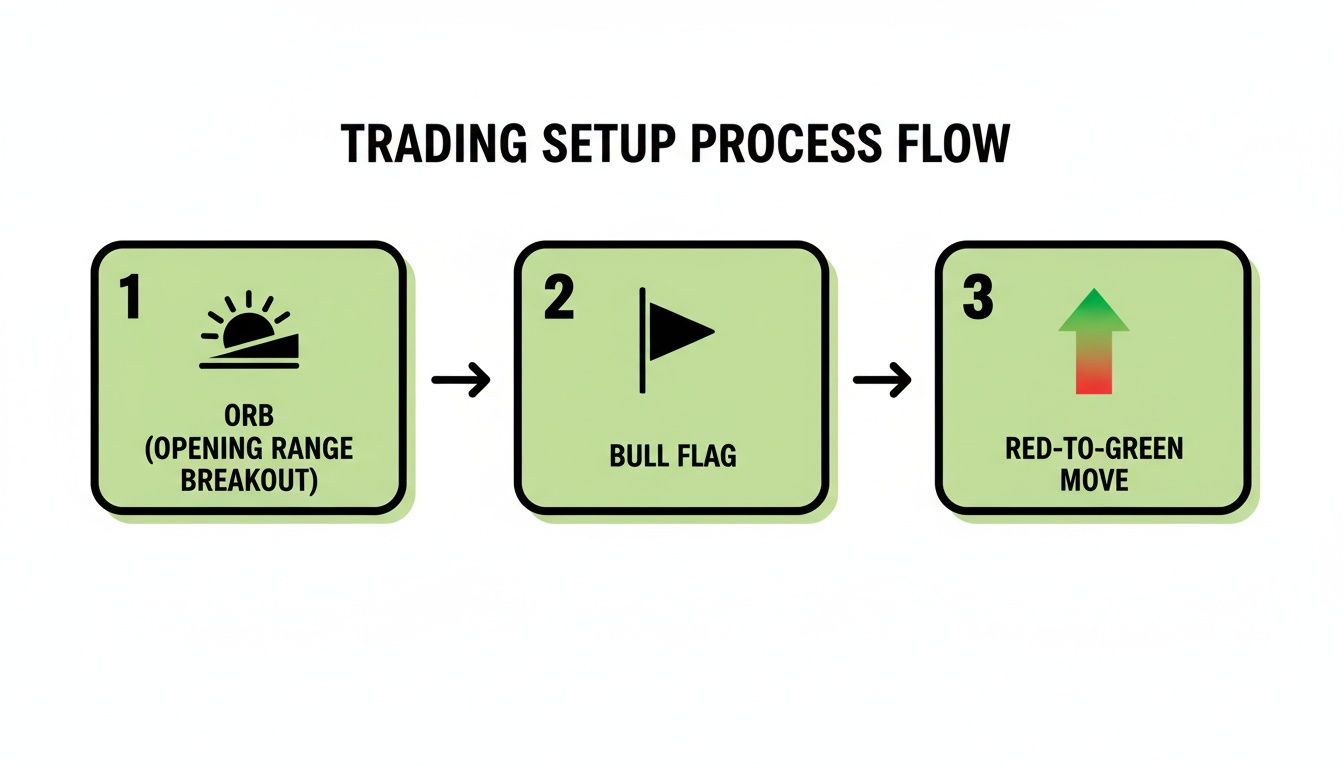
As you can see, once you've identified a primary setup like an ORB, your mind should immediately pivot to execution—where's my entry, and where's my stop?
How to Manage a Winning Trade
Ironically, managing a winning trade is often harder than taking a loss. The fear of giving back profits can cause you to exit too soon. The key is to balance securing gains with letting the stock do its thing. A technique used by virtually every professional trader is scaling out.
For example, as the stock hits your first target—let's say a 2:1 reward-to-risk ratio—you might sell 25-50% of your shares. This simple act does two things: it banks real profit and reduces your risk on the remaining position. After that first sale, you can move your stop-loss to your entry price, creating a "risk-free" trade with the rest of your shares.
"Pay yourself along the way." This isn't just a catchy phrase; it's a core tenet of consistent trading. Taking partial profits into strength smooths your equity curve and builds the psychological capital you need to stay in the game.
While indicators like the RSI can help you read momentum, be careful. Backtesting on the S&P 500 has shown some RSI strategies can produce an impressive 14.2% annual return. However, these results can be incredibly fragile and sensitive to small tweaks, which shows how easy it is to over-optimize a strategy. You can dive deeper into the performance and risks of these strategies in this statistical breakdown.
Choosing Your Exit Strategy
So you've taken some profit. Now, when do you sell the rest? There’s no single correct answer. Choosing the right exit strategy depends on the trade's momentum and your risk tolerance.
This table compares a few common approaches.
| Exit Strategy | Best For | Pros | Cons |
|---|---|---|---|
| Fixed Profit Target | Quick scalps or stocks nearing major resistance. | Simple to execute, ensures you take profits. | Can leave significant money on the table in a strong trend. |
| Trailing Stop | Strong, trending stocks with clear momentum. | Lets winners run, protects profits automatically. | Can get stopped out early on normal pullbacks or chop. |
| Moving Average Cross | Slower, grinding trends on the 5-min chart. | Keeps you in a trade as long as the trend is intact. | A lagging signal; you often give back some profit. |
Each of these has its place. Having a clear rule removes the emotional guesswork of trying to sell at the absolute top.
For instance, on a stock that's running hard, I might use the 9-period EMA on the 1-minute chart as my trailing stop. My rule is simple: as long as the price stays above that moving average, I stay in the trade. The moment a candle closes below it, I'm out. No questions, no regrets.
Mastering Risk and Journaling for Consistent Growth
In momentum day trading, what really separates the pros from the washouts isn't a magical ability to pick winners. It's not about being right all the time. It’s about obsessive risk management and a commitment to learning from every single trade you take.
This is the unglamorous, behind-the-scenes work. But make no mistake, it’s the bedrock of any lasting success in this business.
Without bulletproof rules to protect your capital, even the slickest strategy will eventually blow up your account. The market doesn't play fair, and one emotional, oversized loss can erase weeks of patient, disciplined gains.
The Non-Negotiable Rules of Risk Management
Before you even think about your next trade, you need to internalize a few rules that are designed for one purpose: to keep you in the game. These aren't suggestions. They're your professional lifeline. Your first job isn't to make money—it's to protect what you already have.
The most important rule of all is the 1% Rule. It’s simple: you never, ever risk more than 1% of your total account balance on a single trade. If you're working with a $30,000 account, your maximum loss on any given trade is $300. Period. This isn't just a guideline; it's a law you must follow.
This rule is what dictates your position size. You don't just guess how many shares to buy. You calculate it based on your stop-loss.
Here’s how it works in practice:
- Account Size: $30,000
- Max Risk (1%): $300
- Entry Price: $50.00
- Stop-Loss Price: $49.50
- Risk per Share: $0.50 ($50.00 – $49.50)
To get your share size, you just divide your max risk by the risk per share: $300 / $0.50 = 600 shares. This calculation ensures your potential loss is capped exactly where you want it, taking the emotion and guesswork right out of the equation.
The market doesn't care about your profit goals, but it will ruthlessly exploit your lack of risk controls. The 1% Rule forces you to respect the market's power on every single trade.
Another critical safety net is a hard daily max loss. Think of this as the circuit breaker for your trading day. A common figure is 3% of your account. If your losses for the day hit that number, you're done. Shut down the platform and walk away. This one rule is the single best way to stop "revenge trading"—that disastrous emotional spiral where you try to force wins to make back what you lost.
The Power of a Trading Journal
If risk management is your defense, your trading journal is your offense. It's the ultimate feedback loop, shining a harsh, honest light on your strengths, your weaknesses, and your psychological blind spots. The 90% of traders who fail almost always skip this part, dooming themselves to repeat the same mistakes over and over again.
A journal is so much more than a P&L spreadsheet. It's your personal diagnostic tool. After every trading day, you have to sit down and document the key details of each trade. This is how you find the patterns in your own behavior.
A solid journal entry should always include:
- The Setup: What was the pattern? A Bull Flag? An Opening Range Breakout? Why did this trade look good to you?
- Entry and Exit Points: Log the exact prices and times for your entry and every exit, especially if you scale out of positions.
- Profit/Loss: The final dollar amount.
- Psychological State: How did you feel? Were you patient? Anxious? Impulsive? Be brutally honest with yourself here.
This process turns trading from what feels like a series of random bets into a data-driven performance game. When you review your journal weekly, you might find you’re incredibly profitable on Red-to-Green moves but you consistently bleed money trying to trade choppy breakouts. That insight is pure gold. It tells you exactly where to focus your energy and where your real edge is.
For anyone just starting out, mastering this entire process in a risk-free setting is non-negotiable. You can learn more about building this routine in our comprehensive guide on how to paper trade effectively.
Common Questions About Momentum Day Trading
As you start digging into momentum trading, you're bound to have questions. It’s a fast-paced style, and it's completely normal to feel a bit overwhelmed at first. Let's tackle some of the most common hurdles new traders face with real, practical answers.
How Much Capital Do I Need to Start?
This is the big one, isn't it? In the United States, the main hurdle is a regulation known as the Pattern Day Trader (PDT) rule. To day trade stocks freely, you need to keep a minimum balance of $25,000 in your account.
If your account dips below that magic number, your broker will restrict you to just three day trades in any five-day stretch. For a momentum strategy that relies on taking multiple shots on goal, that's a serious roadblock.
But even beyond the official rule, think about it practically. Let's say you're properly applying the 1% risk rule on a small account. Your risk per trade might only be a few bucks. The problem is, commissions and fees can easily gobble up those small potential wins, making it almost impossible to get ahead. For traders with smaller accounts, it's often more effective to swing trade momentum stocks over a few days, which avoids the PDT restrictions.
What Are the Best Times of Day for Momentum Trading?
In momentum trading, the clock is your friend… or your enemy. You'll find that the highest-probability setups are packed into two key windows of the day. Everything else is mostly noise.
The Morning Rush (9:30 AM – 11:00 AM ET)
This is go-time. The first 90 minutes after the opening bell are electric. You have a flood of volume from overnight news, pre-market movers, and big institutional orders hitting the market all at once. This creates the powerful, clean volatility we need to find explosive moves.
The Closing Hour (3:00 PM – 4:00 PM ET)
The day often ends with a second burst of activity. As traders and funds look to either close out their daily positions or establish new ones overnight, you can see another wave of significant momentum. This can create some fantastic late-day opportunities.
The hours in between, roughly from 11:00 AM to 3:00 PM ET, are what traders call the "lunchtime doldrums." Volume dries up, and stocks tend to get choppy and unpredictable. As a developing trader, your best move is to simply step away during this period.
How Do I Stop Chasing Stocks That Have Already Run?
Chasing is a classic mistake, and it’s fueled entirely by the Fear of Missing Out (FOMO). It's agonizing to watch a stock double without you, but jumping in late is a surefire way to get burned. The only cure for FOMO is having a strict, non-negotiable set of rules.
A core rule for disciplined traders is this: Never buy a stock that is dramatically extended from a key moving average, like the 9-period EMA, or far above the VWAP. Chasing strength is a losing game; waiting for a structured entry is a professional one.
Instead of panic-buying a stock that's already gone vertical, you have to train your patience. A truly strong stock will rarely move in a straight line forever. It will usually pull back to a support level, form a small flag or pennant, and offer a much safer, lower-risk entry for its next move higher. If you miss the first big pop, just let it go. Your job isn't to catch every move; it's to wait for the right setup.
Can I Use These Strategies on Any Stock?
Definitely not. Trying to apply these tactics to the wrong kind of stock is a recipe for disaster. This playbook is built specifically for stocks with a certain personality.
They work best on stocks that have:
- High Relative Volume: The stock has to be trading way more shares than it normally does. This is the footprint of intense institutional and retail interest.
- A Clear Catalyst: There should be a real reason for all the excitement—a big earnings beat, major FDA news, a new contract, or some other game-changing event.
- Sufficient Liquidity: The stock needs to trade enough volume so you can get in and out cleanly without getting terrible prices (slippage) or dealing with a huge gap between the bid and ask price.
If you try to trade a slow, sleepy, low-volume stock with these methods, you’ll just get stuck in choppy price action. This is exactly why a disciplined pre-market scan is so critical—it’s how you filter the thousands of stocks out there down to the handful that are actually "in play" and worth your attention.
Ready to stop guessing and start trading with a proven system? Channeling Stocks provides curated weekly watchlists of stocks trading in predictable channels, giving you the edge you need to trade with confidence. Start your free 14-day trial today and see the difference for yourself at Channeling Stocks.