
A bottom head and shoulders, often called an inverse head and shoulders pattern, is one of the most reliable bullish reversal signals in a technical trader's toolkit. When you see one forming, it’s a strong clue that a long downtrend is running out of gas and a new uptrend is about to get started.
For traders, correctly identifying this pattern feels like getting an early tip-off about a major market turning point. It presents a high-probability chance to get in on a new bull run right near the bottom.
How to Spot a Winning Reversal Pattern
Every chart pattern tells a story, and the inverse head and shoulders is a classic tale of a power shift. Picture a prolonged struggle where sellers have been in complete control, pushing prices lower and lower. This pattern shows you the exact moment they start to lose their grip.
It isn't just a random shape. It's a visual map of seller exhaustion giving way to renewed buying pressure. Think of it as the market taking one final, deep dip before launching into a powerful new advance. For swing and wave traders, learning to spot this formation is a game-changer, allowing you to catch major uptrends from the very beginning.
The Foundation of a Bullish Turnaround
At its core, the pattern consists of three troughs, or price lows. The middle low (the "head") is the deepest point, while the two troughs on either side (the "shoulders") are shallower and roughly symmetrical.
A straight line drawn across the peaks between these lows forms the "neckline," which serves as a critical resistance level.
The real confirmation—the green light for traders—is a decisive price break above this neckline. This move signals that buyers have finally overpowered the sellers, and the reversal from bearish to bullish is officially on.
Let's quickly break down the key parts of the formation. Seeing how each piece fits together helps you understand the underlying psychology of the market as it turns.
Bottom Head and Shoulders Pattern at a Glance
This table maps out the five essential components of the pattern, showing how they unfold in sequence and what each one tells us about the battle between buyers and sellers.
| Pattern Component | Description | Market Implication |
|---|---|---|
| Prior Downtrend | A clear and established downward trend in price. | This is the necessary setup. Without a preceding downtrend to reverse, the pattern is meaningless. |
| Left Shoulder | The first trough in the pattern, followed by a temporary rally. | Represents an early, but failing, attempt by sellers to continue pushing the price down. |
| Head | The lowest trough in the sequence, dipping below the left shoulder. | This is the point of maximum pessimism and often marks where sellers finally capitulate or run out of steam. |
| Right Shoulder | The third trough, roughly symmetrical to the left shoulder in depth. | A clear sign of strength. Buyers are now stepping in sooner, preventing the price from dropping to a new low. |
| Neckline Break | Price closes decisively above the line connecting the peaks. | This is the confirmation. It validates the bullish reversal and signals a potential entry point for a long trade. |
By recognizing these distinct stages, you can move beyond simply seeing shapes on a chart and start reading the market's unfolding narrative with much greater confidence.
Decoding the Anatomy of a Bullish Reversal
To really get a feel for the bottom head and shoulders formation, you have to see it as more than just a shape on a chart. It’s a story. Specifically, it's the story of a battle between sellers and buyers, where the tide slowly but surely turns in the buyers' favor. Once you learn to break down each part of the pattern, you can read this story as it unfolds in real time.
Think of it like a three-act play marking the end of a long downtrend. Each scene reveals a subtle but critical shift in market power, moving from total seller control to the beginning of a new, buyer-led rally.
This chart gives you a bird's-eye view of how the pattern works, showing the transition from a downtrend to a fresh uptrend.
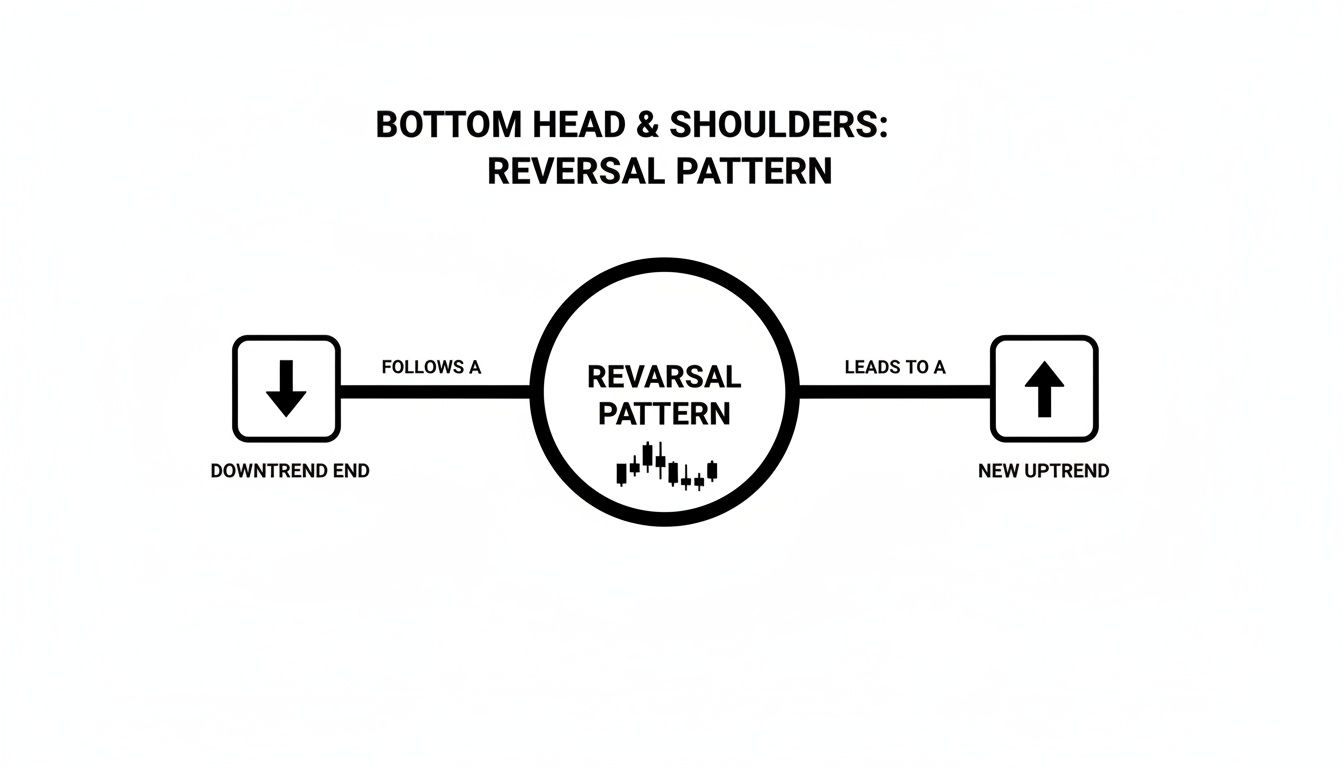
As you can see, its entire purpose is to signal that the previous downtrend is over and a new upward move is likely starting. That's why it's such a powerful signal for traders looking to get in early.
The Left Shoulder: The First Sign of a Fight
This whole formation kicks off after the price has already been falling for a while. The Left Shoulder is the first significant low you'll see, followed by a small bounce. Honestly, at this point, it doesn't look like much—just another dip in an ongoing bear market.
But something important is happening under the surface. Sellers pushed the price to that new low, but the rally that followed shows buyers are starting to sniff around, seeing potential value. Sellers are still in charge, but this is the first crack in their armor.
The Head: The Moment of Maximum Pessimism
After that brief rally from the left shoulder, sellers give it one last, aggressive shove. They manage to push the price to an even lower low, which forms the Head of the pattern. This is the absolute bottom of the entire formation and represents the point of maximum despair.
This is the capitulation moment. It’s where the last of the nervous investors finally throw in the towel and sell. But in doing so, the selling pressure exhausts itself. The rally that comes after the head is often much stronger than the one after the left shoulder, which tells you that serious buying power is now stepping into the ring.
The Right Shoulder: The Buyers Take a Stand
Following the rally off the head, sellers try to regain control with one more push down. This attempt creates the Right Shoulder. The crucial detail here is that this low is higher than the head, often settling around the same price level as the left shoulder.
This is a massive tell. The fact that sellers couldn't even get close to the previous low shows a clear transfer of momentum. Buyers are now stepping in much earlier and with more confidence, essentially drawing a line in the sand.
The general symmetry between the left and right shoulders suggests an orderly and balanced handover of power. It’s a visual sign that the bearish mood has been fully absorbed and replaced by bullish conviction.
The Neckline: The Ultimate Confirmation Line
The last piece of the puzzle is the Neckline. You draw this line by connecting the high points of the two small rallies—the one after the left shoulder and the one after the head. This line acts as a resistance level, the final barrier sellers are trying to defend.
The neckline can slope in different directions, and each tells a slightly different story:
- Upward-sloping: This is the most bullish sign, showing that buyers are getting more aggressive at higher and higher prices.
- Horizontal: The classic, textbook version. It's clean and very reliable.
- Downward-sloping: The pattern is still valid, but this signals a bit more overhead resistance. The resulting breakout might be less explosive.
The pattern isn’t truly complete until the price breaks out and closes decisively above this neckline. That breakout is the official green light, signaling the bullish reversal is on. If you're just getting started with chart analysis, mastering these basic components is essential. For a deeper dive into the fundamentals, check out our guide on how to read stock charts for beginners.
Volume: The Conviction Behind the Move
Volume is the "lie detector" for this pattern. A textbook formation has a distinct volume signature that confirms the psychological story we've been talking about.
- Left Shoulder: Volume is usually pretty high here, as sellers are still actively driving the price down.
- Head: You might see a volume spike on the final plunge to the low, but volume often tapers off during the subsequent rally. This is a sign of seller exhaustion.
- Right Shoulder: Volume is typically at its lowest point in the pattern on the right shoulder. This is a huge clue that there's just not much selling interest left.
- Breakout: The breakout above the neckline must happen on a significant surge in volume. This is the ultimate confirmation that buyers have taken firm control and that there's real power behind the new uptrend.
Confirmation Rules and Trading Strategies

Spotting a bottom head and shoulders forming on a chart is one thing, but knowing how to trade it is a completely different ballgame. A potential pattern is just that—potential. Until it's confirmed, it’s nothing more than an interesting shape.
This is where a clear set of rules separates disciplined traders from those just hoping for the best. The entire setup hangs on a single, critical event: the breakout. Think of the neckline as a line in the sand drawn by the bears; the pattern isn't real until the bulls push the price decisively across it.
The Ultimate Confirmation Signal
So, what are we watching for? The number one confirmation signal is a decisive price close above the neckline. A quick little poke above the line during the trading day doesn't cut it. We need to see the price close firmly above that level, proving the buyers have wrestled control away from the sellers.
But price alone doesn't tell the whole story. The volume on that breakout is just as important. A true, valid breakout should happen on noticeably higher-than-average trading volume. That surge in activity tells you there's real conviction behind the move. A breakout on weak, anemic volume is a major red flag—it often signals a "fakeout" that's likely to fail.
When you see a strong price close above the neckline combined with a big spike in volume, that's your green light. This is the market confirming that the old downtrend is likely over and a new uptrend is beginning.
How to Enter the Trade
Once you have that confirmation, you've got two main ways to enter the trade. The one you choose really depends on your own appetite for risk.
1. The Aggressive Entry: Trading the Breakout
This is for traders who don't want to risk missing the move. The moment you get that confirmed close above the neckline, you enter a long position.
- The upside? You get in right at the start. If the breakout is powerful, you'll be positioned to capture the entire initial leg up.
- The downside? You're more exposed to "false breakouts," where the price pops above the neckline just long enough to suck you in before reversing lower.
2. The Conservative Entry: Waiting for the Retest
A more patient—and often higher-probability—method is to wait for a pullback. It's incredibly common for price to break through a key resistance level (the neckline) and then circle back to "test" it from above. The old resistance now becomes new support. You'd enter your trade as the price bounces off this newly established support.
- The upside? This approach confirms the neckline has officially flipped from a ceiling to a floor, giving you a much stronger entry signal and often a better risk/reward setup. We cover this concept in-depth in our guide to support and resistance trading strategy.
- The downside? Sometimes, the retest never happens. In a very powerful move, the price might just keep running, leaving you behind on the platform.
Setting Your Stop Loss and Profit Target
No trade is complete without a plan for when to get out, both for a loss and for a win.
Stop-Loss Placement
Your stop-loss is your safety net. For a bottom head and shoulders, the most logical place to set it is just below the low of the right shoulder. That level was the last stand for the buyers before the final push up. If the price breaks back below it, your reason for being in the trade is no longer valid. For a tighter stop, some traders place it just below the neckline after a successful retest.
Profit Target Calculation
The classic technical analysis method for calculating a target is beautifully simple and is based on the size of the pattern itself.
- Measure the Height: First, measure the vertical distance from the lowest point of the head up to the neckline.
- Project the Target: Next, take that same distance and add it to the point where the price broke out from the neckline. That price level is your minimum profit target.
This "measured move" gives you a data-driven target to aim for, preventing you from getting out too early or staying in too long. As a powerful bullish reversal pattern, the Head and Shoulders Bottom is a favorite for good reason. In major U.S. markets, backtesting has shown that these patterns can produce average gains of 20-30% within 3-6 months after the breakout, a testament to their reliability. You can dive deeper into this pattern's effectiveness on StockCharts.com.
Real World Examples of This Formation in Action
Theory is great, but the real learning happens when you see the bottom head and shoulders formation show up on a live chart. This is where you move past the clean diagrams and learn to spot the pattern in the wild, where things are rarely perfect. Each chart tells a story of a trend dying and a new one being born.
We're going to walk through a couple of examples—one that’s almost too perfect and another that’s a bit messy. Charting is part art, part science. You have to train your eye to see the underlying structure, even when it’s not a flawless picture. Let's look at the narrative behind a few real trades.
Example 1: The Textbook Reversal
First up, a textbook case. You couldn't ask for a cleaner setup. After a long, punishing downtrend, the stock's price action started to hint that the sellers were finally running out of steam.
You can see the whole pattern unfold in a logical sequence. This is the kind of formation traders love because it checks all the boxes, making the analysis and trade plan pretty straightforward.
- Left Shoulder: The stock makes a clear low and then bounces. At this point, it just looks like any other minor rally in a downtrend. Nothing special yet.
- Head: Here, sellers give it one last, desperate shove, pushing the price to its absolute bottom. This is the moment of peak fear, but the rally that follows is much stronger than the first one, signaling a real shift in power.
- Right Shoulder: Buyers now refuse to let the price drop back to the previous low. They step in sooner, creating a higher low that's roughly in line with the left shoulder. This failure by sellers is a huge red flag for them.
- Neckline & Breakout: The peaks of the rallies form a neat, almost horizontal neckline. The confirmation comes when a strong candle closes decisively above that line, and you can see a big spike in volume. That volume tells you the buyers mean business.
For a setup this clean, the trade plan was simple. You'd enter when the breakout candle closed, place your stop-loss just under the low of the right shoulder, and set a profit target by measuring the distance from the head to the neckline and adding it to the breakout price.
Example 2: The 'Messy' but Valid Pattern
Not every bottom head and shoulders formation will look like it came out of a textbook. In fact, most don't. You'll often find asymmetrical patterns, sloping necklines, and shoulders that don't quite line up. This is where your discretion as a trader really comes into play.
In this second chart, the stock was in a choppy, grinding downtrend. The reversal pattern that formed was much less symmetrical; the right shoulder was a bit lower and took more time to develop than the left. This is the kind of price action that often spooks newer traders.
What’s interesting here is the upward-sloping neckline. Don't let that throw you off—it's actually a very bullish sign. It shows that with each little rally inside the pattern, buyers are getting more aggressive and pushing the peaks higher, even before the final breakout.
Analyzing the Trade:
- Identification: Even though it was lopsided, the key parts were all there: a clear head sitting below two less-defined shoulders.
- Confirmation: The make-or-break signal was the stock closing firmly above that sloping neckline. No matter how messy the pattern, the breakout rule is the one thing you can't compromise on.
- Volume: And just as importantly, look at the volume. It surged on the breakout day, which helped validate the move and gave confidence that the bullish turn was real, despite the imperfect shape.
This example is a great lesson: you have to focus on the principles, not on visual perfection. The chart was still telling the same story of sellers getting exhausted and buyers taking control, just with a slightly different accent. If you're looking to build out your toolkit, understanding other reversal patterns like the cup and handle can provide additional context.
Ultimately, seeing these patterns in the real world shows that successful trading is all about being flexible. Once you truly internalize the psychology behind the bottom head and shoulders formation, you’ll start seeing high-probability setups even when they don't look exactly like the ones in a book.
Common Pitfalls and How to Avoid False Signals

Let's be clear: no chart pattern is a crystal ball, and the bottom head and shoulders formation is no exception. The market is littered with "almost" setups and outright traps designed to part impatient traders from their money. Learning to spot these false signals is just as important as identifying a perfect pattern.
The single biggest trap is jumping the gun. I've seen it countless times. A trader gets excited by a shape that looks like a bottom is forming, but they act before the pattern is confirmed. Remember, until the price closes decisively above that neckline, it’s just a bunch of wiggles on a chart, not a tradable signal.
Then there's the dreaded "failed" pattern. This is where the price breaks the neckline, everything looks great for a moment, and then it slams back down. This brutal fakeout is why your stop-loss placement is never, ever negotiable.
The Dangers of Trading Without Context
Context is king in trading. A pattern that shows up out of nowhere is far less reliable than one that fits into the broader market story. Before you even think about a trade, you have to ask: is there a clear, preceding downtrend?
A bottom head and shoulders formation is a reversal pattern. Its job is to signal the end of a long slide. If the stock hasn't been falling, what is there to reverse? A pattern without a trend to reverse is usually just random market noise.
A pattern without a prior trend is like a punchline without a joke—it makes no sense. Always zoom out on your chart to confirm the bigger picture before focusing on the smaller formation.
Patience is another part of the context. Real, durable bottoms don't form overnight. A true reversal often takes months to play out on a daily chart. If you see a pattern that forms in just a few days, be skeptical. It's often too rushed to be reliable.
Validating the Breakout Volume Is Non-Negotiable
If price is what happened, volume tells you how it happened. Volume is your lie detector. A genuine, powerful reversal is driven by a tidal wave of buying, and that conviction shows up in the volume bars at the bottom of your screen.
Here’s the story volume should be telling you:
- Low Volume on the Right Shoulder: As the right shoulder takes shape, volume should ideally be petering out. This is a great sign that sellers are exhausted and running out of steam.
- Massive Volume on the Breakout: The day price punches through the neckline, you need to see a massive spike in volume. It should tower over the recent average. This is the market screaming that the buyers have seized control.
A breakout on flimsy, average volume is a giant red flag. It’s like hearing a tiny cheer from the crowd instead of a stadium-wide roar. It suggests a lack of real conviction and dramatically increases the odds of a fakeout. Don't ever trade a breakout that volume doesn't confirm.
Distinguishing a Strong Setup from a Trap
Knowing the difference between a textbook setup and a clever trap is what separates consistently profitable traders from the rest. To make it easier, I've put together a checklist to help you quickly sort the good from the bad.
Think of this table as a quick field guide for vetting a pattern before you risk a single dollar.
High-Probability Setup vs. Potential False Signal
| Characteristic | High-Probability Setup | Potential False Signal |
|---|---|---|
| Prior Trend | A clear, established downtrend is present. | No clear downtrend, or the price is in a sideways range. |
| Neckline Break | Price closes decisively above the neckline. | Price only pierces the neckline briefly, fails to close above it. |
| Breakout Volume | A significant spike in volume, well above average. | Volume is low, average, or even declining on the breakout. |
| Symmetry | Shoulders are roughly symmetrical in height and duration. | The pattern is highly distorted or lopsided. |
| Right Shoulder Low | The low of the right shoulder is above the head's low. | The right shoulder drops to or below the level of the head. |
Running every potential bottom head and shoulders formation through this simple filter will help you steer clear of low-quality signals and focus your capital only on the setups that have the highest odds of working in your favor.
Answering Your Top Questions
Once you start spotting this pattern on your charts, you'll naturally have a few questions. That's a good thing—it means you're thinking like a trader. Let's tackle some of the most common ones I hear so you can approach these setups with more confidence.
How Long Should This Pattern Take to Form?
There's no stopwatch for this. A bottom head and shoulders formation can take anywhere from a few weeks to several months to play out on a daily chart. In fact, if you see one form in just a couple of days, you should be skeptical. It's probably too rushed to be reliable.
What matters more than the exact duration is the pattern's proportion and symmetry. A healthy, well-formed pattern will have a certain balance to it—the time it takes to form the left shoulder and head should feel roughly similar to the time it takes to form the head and right shoulder. This visual balance is a sign of an orderly, deliberate shift in control from sellers back to buyers.
What if the Neckline Is Sloping?
A sloping neckline is perfectly normal and doesn't invalidate the pattern at all. Actually, the slope can give you some valuable clues about the underlying strength of the potential reversal.
- An upward-sloping neckline is a great sign. It tells you buyers are getting impatient and stepping in at progressively higher prices, even before the official breakout. This points to strong, underlying demand.
- A downward-sloping neckline is still a valid signal, but it's considered a bit weaker. It suggests there's still some selling pressure to overcome, and the breakout might not be quite as explosive.
Either way, the rules for trading it don't change. You're still waiting for a decisive price close above that neckline on a pop of volume to confirm the reversal is on.
A sloping neckline doesn't change the rules of the game; it just changes the angle of the playing field. The breakout is still the ultimate confirmation signal.
Can This Pattern Appear Within a Larger Price Channel?
Absolutely. And when it does, it's one of the most powerful buy signals you can find. Spotting a bottom head and shoulders near the lower support line of a long-term channel is a textbook example of a high-probability setup.
What you're seeing is a confluence of technical signals. The stock isn't just hitting a major, established support level; it's also carving out a classic bullish reversal pattern right on top of it. When you get that kind of confirmation from two different forms of analysis, the odds of a successful move higher increase significantly. It’s a setup that disciplined traders are always hunting for.
At Channeling Stocks, we specialize in identifying stocks moving in predictable patterns, just like the ones discussed here. Our service provides curated weekly lists and daily picks to help you find high-probability setups and trade with greater confidence. Start your two-week free trial today and discover a more disciplined approach to trading.